Think you can complete your BEAD application in 90 days? Think again.
January 18, 2024
If you're waiting for your state's application, you'll be too late.


Identifying unserved and underserved communities is the central challenge for policymakers when deciding where to allocate federal broadband funding flowing from the BEAD grants.
To bring more precision to the process, Broadband Money uses multiple sets of data that measure network performance to build the Ready Speed Rank. We have combined datasets collected by Measurement Lab (MLab,) Ookla, and the Federal Communications Commission’s form 477 data. The benefit of this approach is that it provides a multi-faceted view of geographic areas – instead of unchecked, self-reported data from providers that is submitted in the form 477 data collection process.
Here’s how the Ready Speed Rank system is better than the FCC's when used as a sole source of truth.
In this article, we compared the FCC’s form 477 data to the address level speed test survey data collected by the state of Vermont. (Remember that the FCC’s form 477 data relies instead on block-level reporting from providers.) Then we compare the Ready Speed Rank to the FCC's form 477 reports.
When we performed this comparison, we found that 41.5% (25,359) of the unserved addresses (service tier below 25/3 Mbps) in Vermont would be classified as "served" if we only relied on the FCC's form 477 data. In contrast, the Ready Speed Rank only shows 0.6% (371) of the unserved addresses from the Vermont survey within blocks that we define as served.
We first associate the address-level speed report data from the state of Vermont to US Census Block data. A total of 310,633 addresses were included in the Vermont study, among which 61,194 (19.7%) households are reported unserved (service tier below 25/3 Mbps.) For each census block, we obtain the FCC 477 data, including the consumer level's maximum download and upload speed.
Fig. 1 shows a mapping comparison of the broadband services from FCC's form 477 reports versus data from Vermont's current address level speed survey.
Table 1 summarizes the results. We show that around 41.5% (25,359) of "unserved” addresses are currently classified as "served” per FCC’s current 477 data.
Fig. 1. Compare the FCC’s Form 477 report (census block level) and Vermont address-level speed survey data.

Table 1. Percentage of addresses classified into different categories based on the FCC form 477 reports. Around 41.51% of currently unserved addresses (reported by Vermont Speed Survey) are within the "served" territory based on FCC's 477 records. Number in each row will add up to 100%
Ready Speed Rank is a metric that integrates FCC 477 form data and Ookla, and MLab speed test data. If the FCC’s 477 report indicates no provider in a census block, we assume the census block is “unserved”. If a census block is reported with upload and download speeds above 25 Mbps/3 Mbps by FCC 477, but MLab and Ookla imply otherwise, we consider this census block “likely unserved”. The Ready Speed Rank only considers a census block as "served" when all three data sources report that a census block is “served.”
In this way, we mitigate the bias brought by potential sampling errors and different speed test methods. Again, Fig. 2a shows the Ready Speed Rank distribution in Vermont, and Table 2 reports the confusion matrix*.
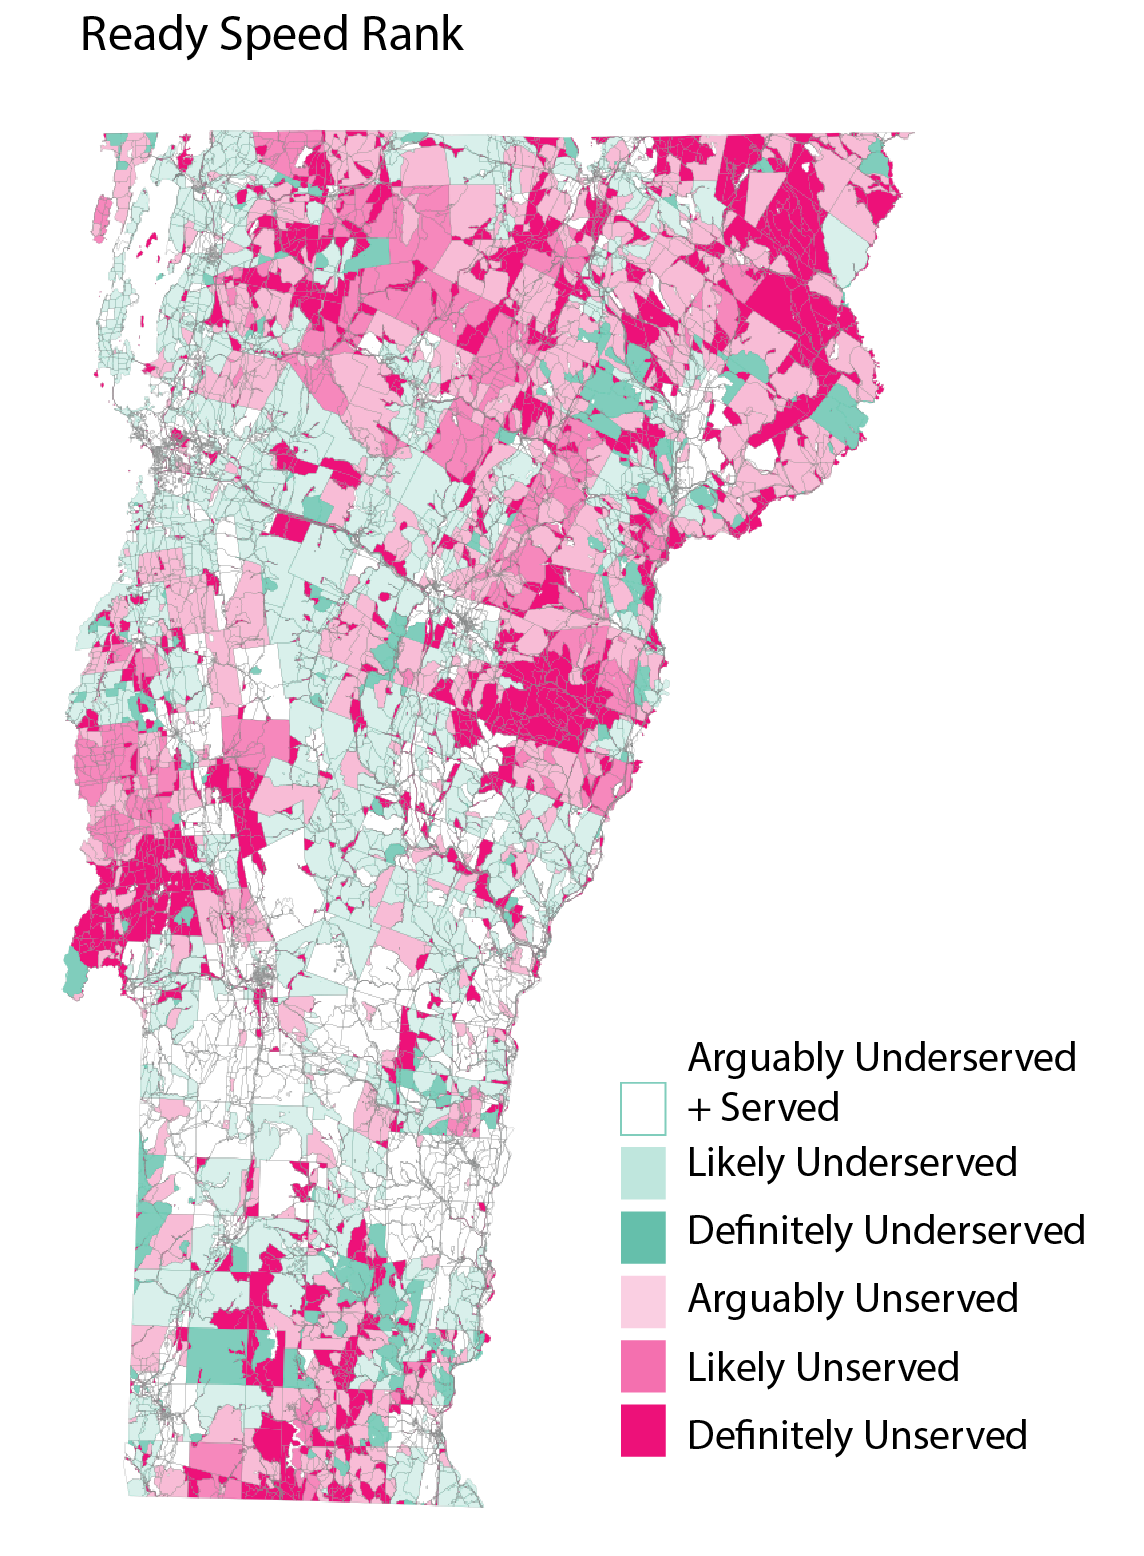
Fig. 2. Distribution of Ready Speed Rank

Table 2. Compare Ready Speed Rank with Vermont speed survey. We can reduce the miss-classification of unserved addresses to 0.61%. By combining other metrics, Ready Speed Rank can capture unserved addresses under the “likely" and "arguably" categories.
To conclude, by leveraging multiple data sources, Ready Speed Rank provides better estimates of the unserved and underserved communities.
This is the first of our case studies to demonstrate how our team leverages data so that policymakers and grant seekers and grant makers can make better funding allocation decisions.
https://publicservice.vermont.gov/content/broadband-availabilityhttps://broadbandusa.ntia.doc.gov/census-block-lists-state-and-territory*Confused? A “confusion matrix” is a data science term that summarizes the results of a classification task. Each address point could be classified as “served”, “underserved”, and “unserved” per Vermont’s speed survey and Ready Speed Rank. The matrix shows the proportion of addresses classified into the same class or different classes by the two methods.
January 18, 2024
If you're waiting for your state's application, you'll be too late.

January 09, 2024
The big sky state joins a small list of eligible entities that have kicked off their broadband challenge process.
It's free. Find out if you qualify for Broadband.money assistance.
