
Setting Up Your Community's Broadband Kit
Learn the basic steps to set up a broadband kit for your community.
Setting up your Community’s Broadband Kit is simple. You’ll need to spend a few minutes filling out a few forms, decide what colors and logos you want associated with your pages, and then we’ll help you establish a Web address.
We recommend that you read through this entire set of instructions so that you’ll be fully prepared to answer the questions in the set-up process.
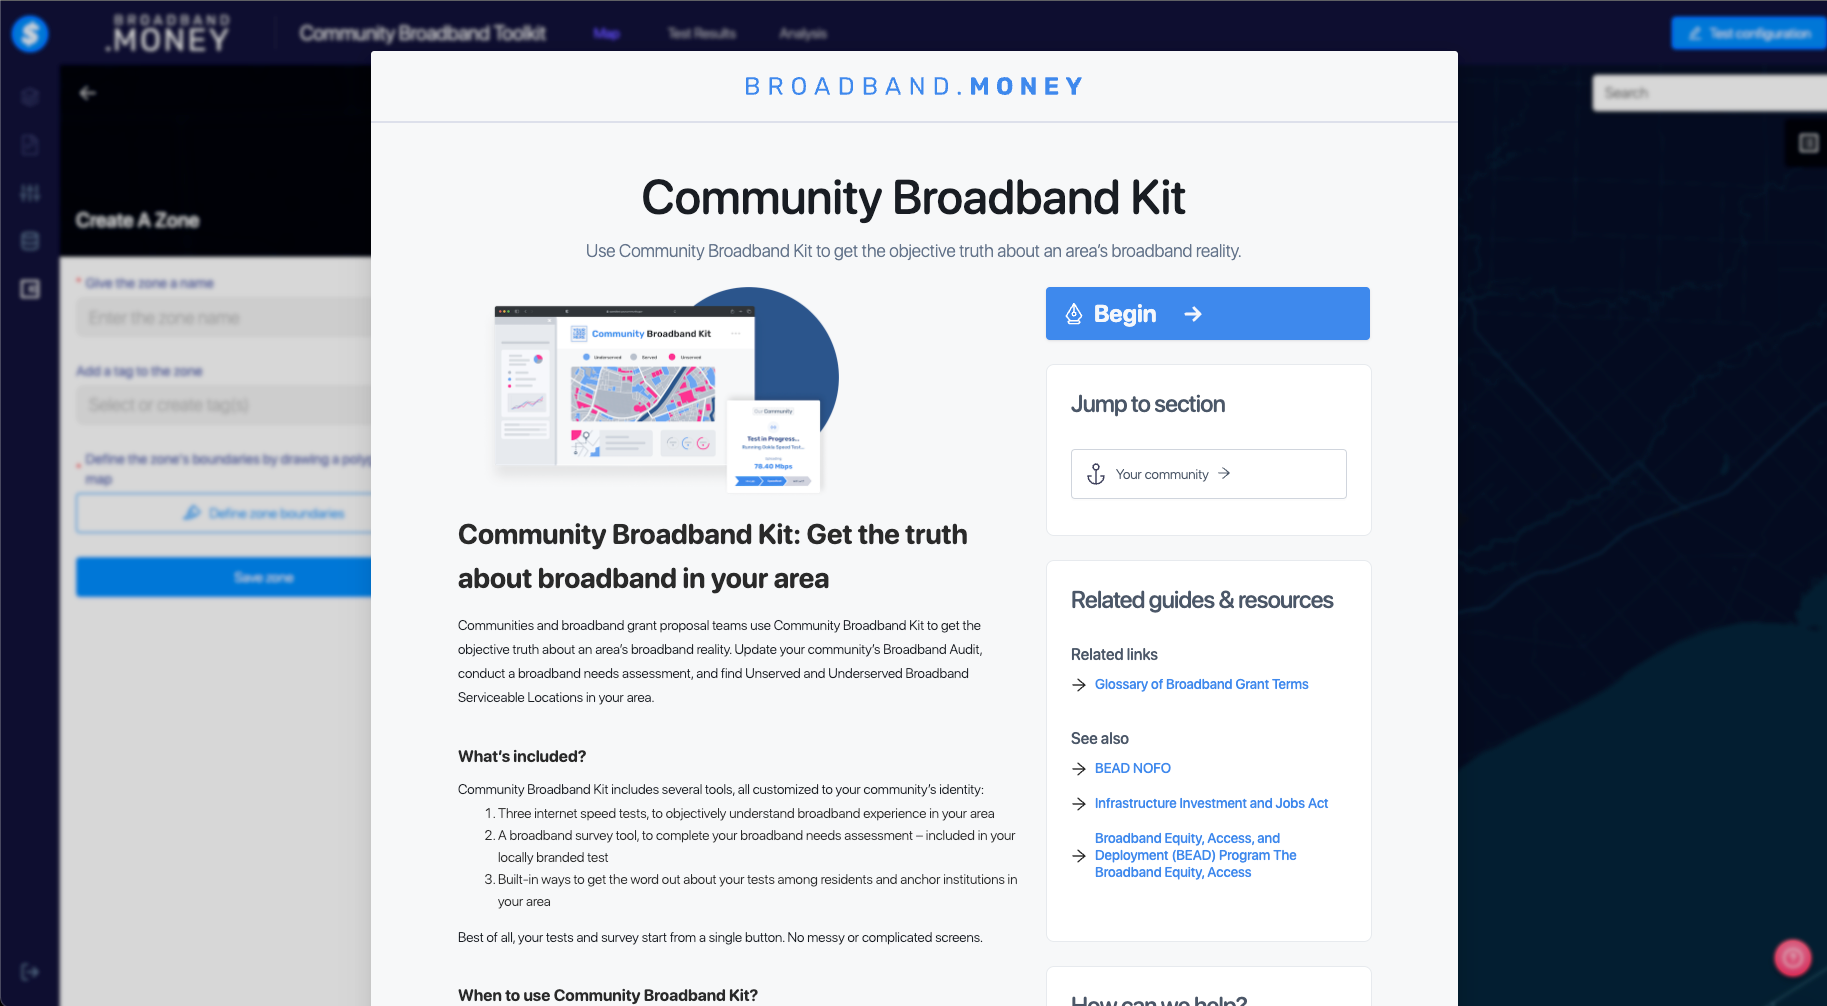
Step 1: Log into Broadband.money. Then click on the “Begin” button.
It would be helpful if you briefly consult a Web designer, or use an online graphics service, such as Canva, to edit images. You can always re-configure your choices, although re-configuring web address information requires a little more legwork, so try to settle on a name and stick with it.
Step 2: Make key decisions before you set up the kit.
You and your community broadband action team leaders need to prepare before setting up your community broadband kit. The below image is a template that you can customize with your territory’s logo, colors, instructions and call-to-action to take an internet speed test.
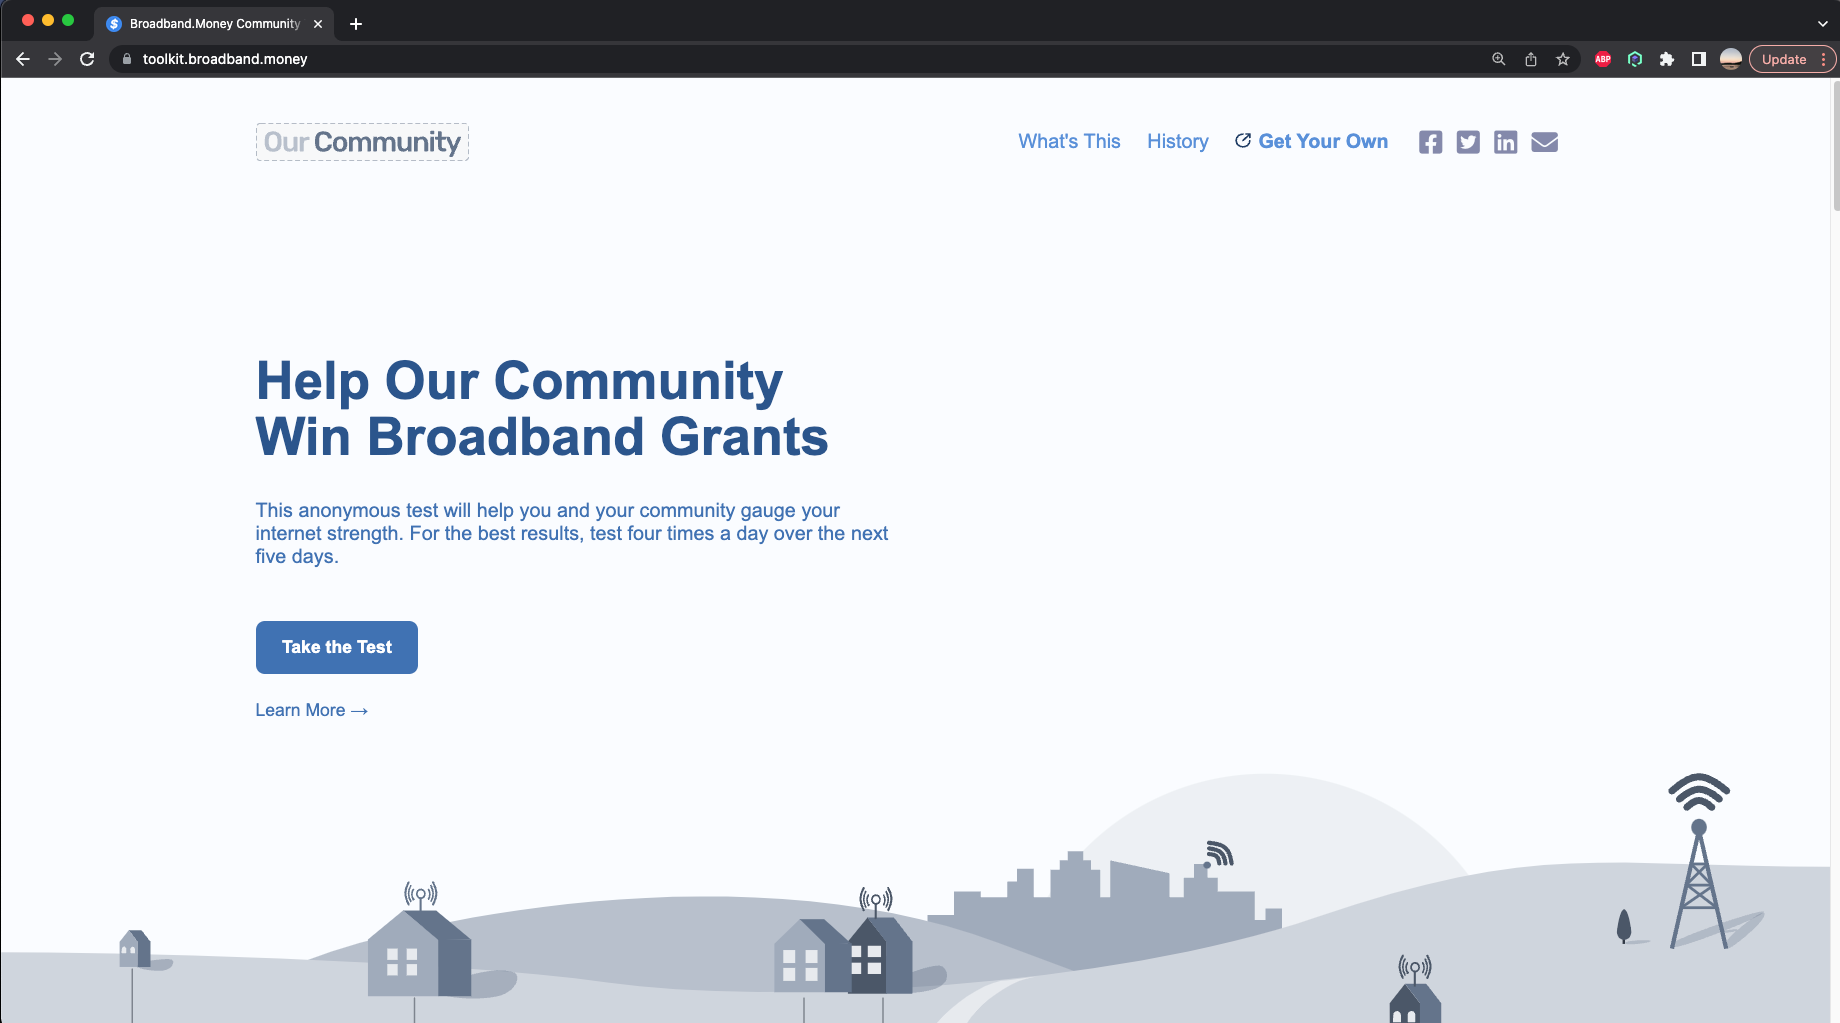
- You will need a site logo — such as a logo for your city, county, or other geographic area where you want to create a geographic representation of internet speed tests that show which addresses that are served, unserved, or underserved. See what the city of Detroit used, for example.
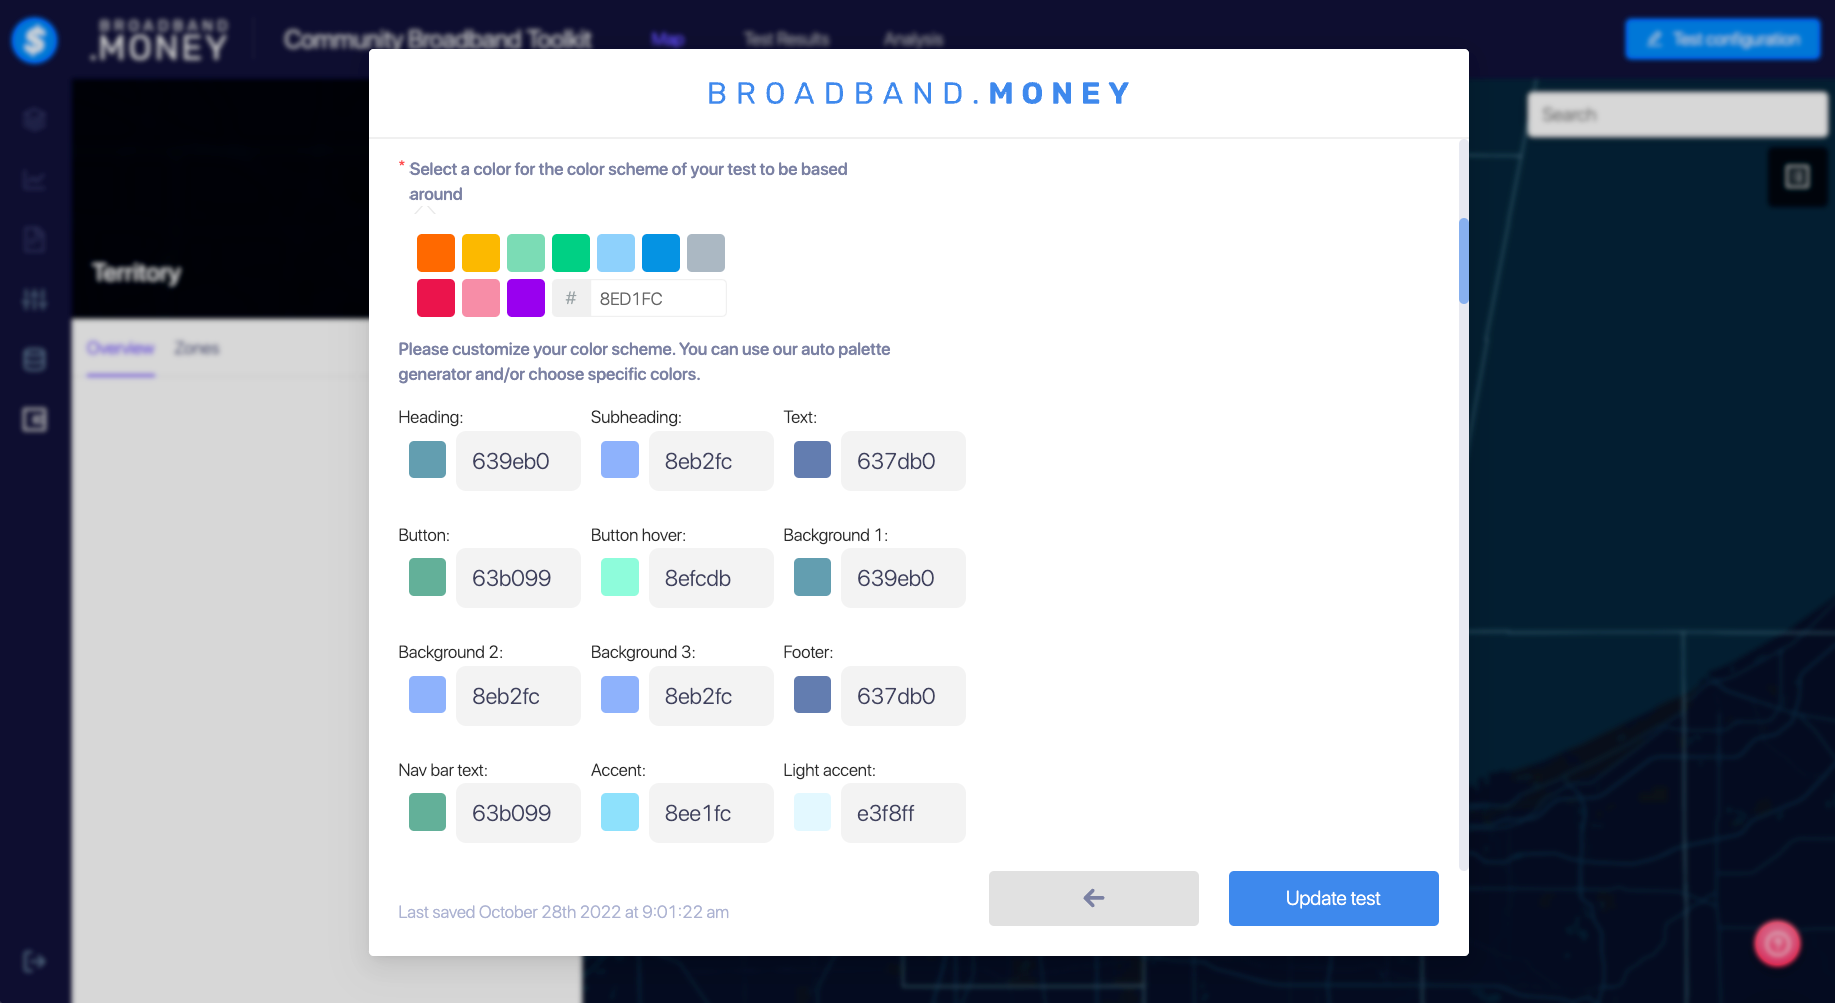
- You’ll also be able to customize the color themes on your community broadband kit. The image below shows some of the choices you’ll be offered.
- Decide what to name the community broadband kit web site address where residents will go to take the test (see the image below.)
We recommend using the name of your city, or county, parish or other geographic unit for a subdomain, and something easy to remember.
For example, a city named Hogwarts might use https://speed.hogwarts.gov for the address of its community broadband kit. Its subdomain would be https://hogwarts.broadband.money. We recommend using a government web site so that broadband community kit test-takers don’t get confused. - Decide whether you will require test takers to list the address associated with their speed test. We recommend that you do. Otherwise, the end result (in the form of a map) won’t precisely reflect speed test information. The address information is stored in the community broadband kit testing database and is not used for any other purpose. You could provide an informational to test-takers to re-assure them about your privacy policies and what is done with the information, and how it is stored.
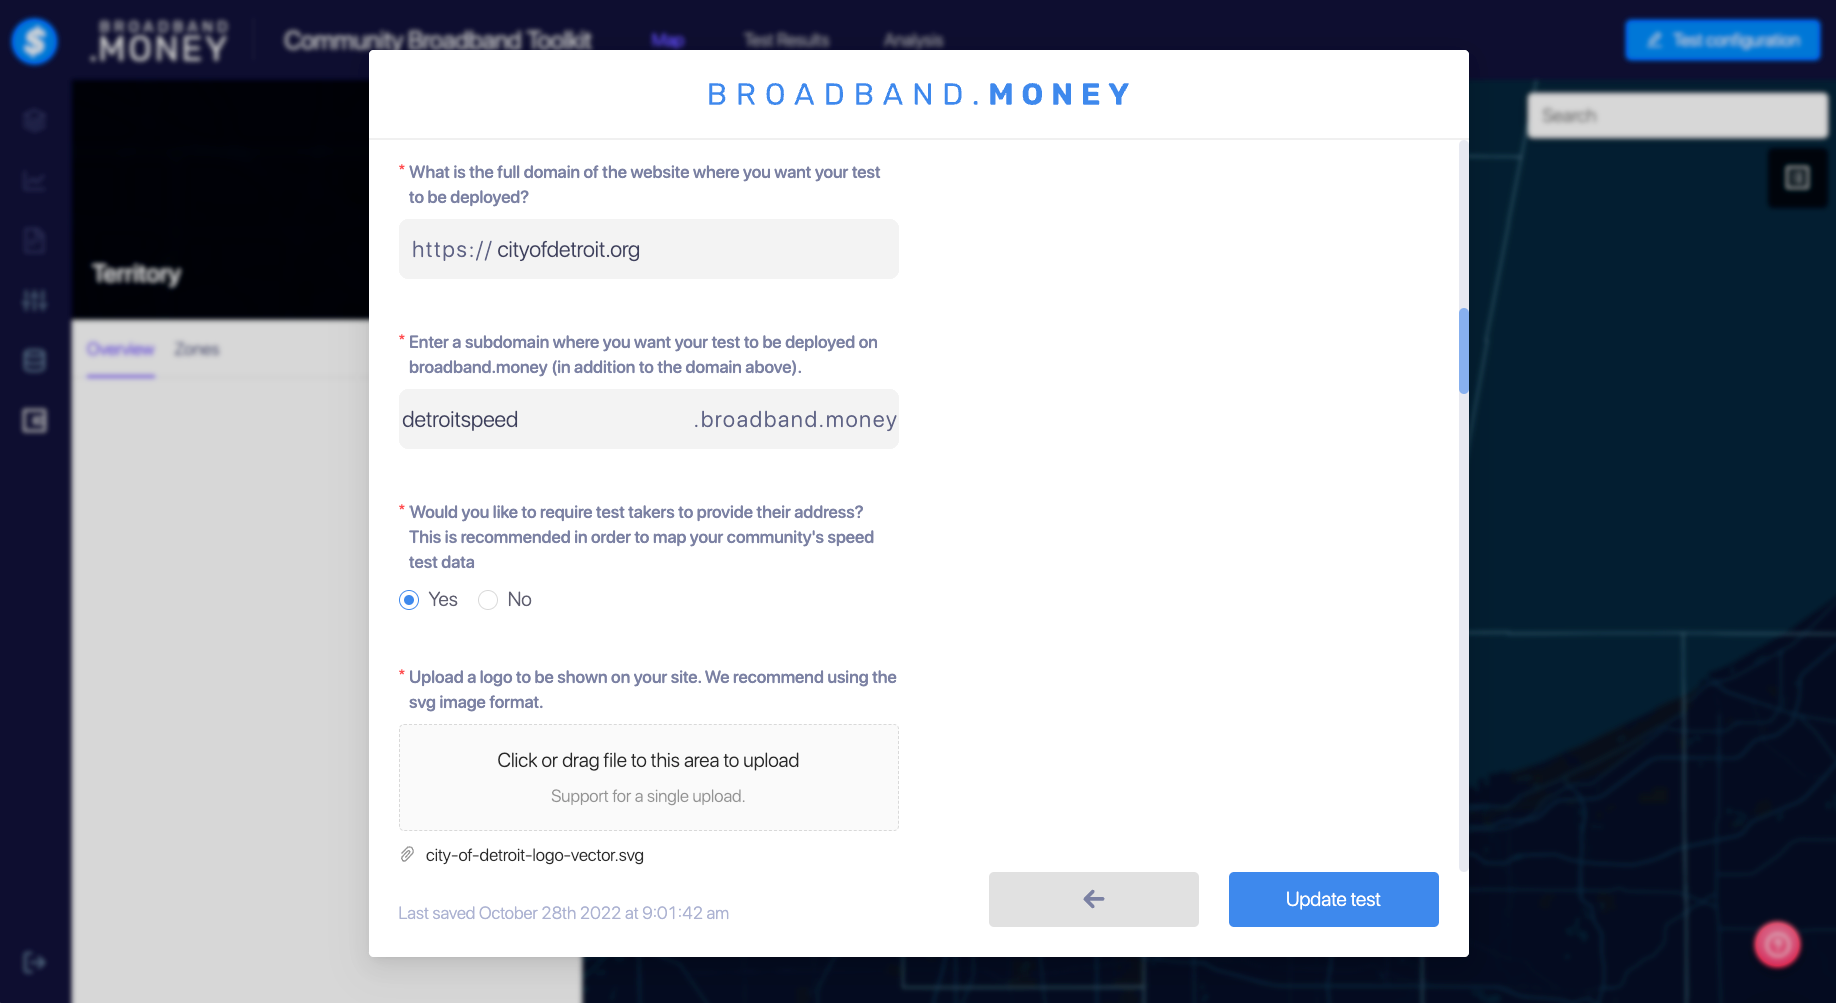
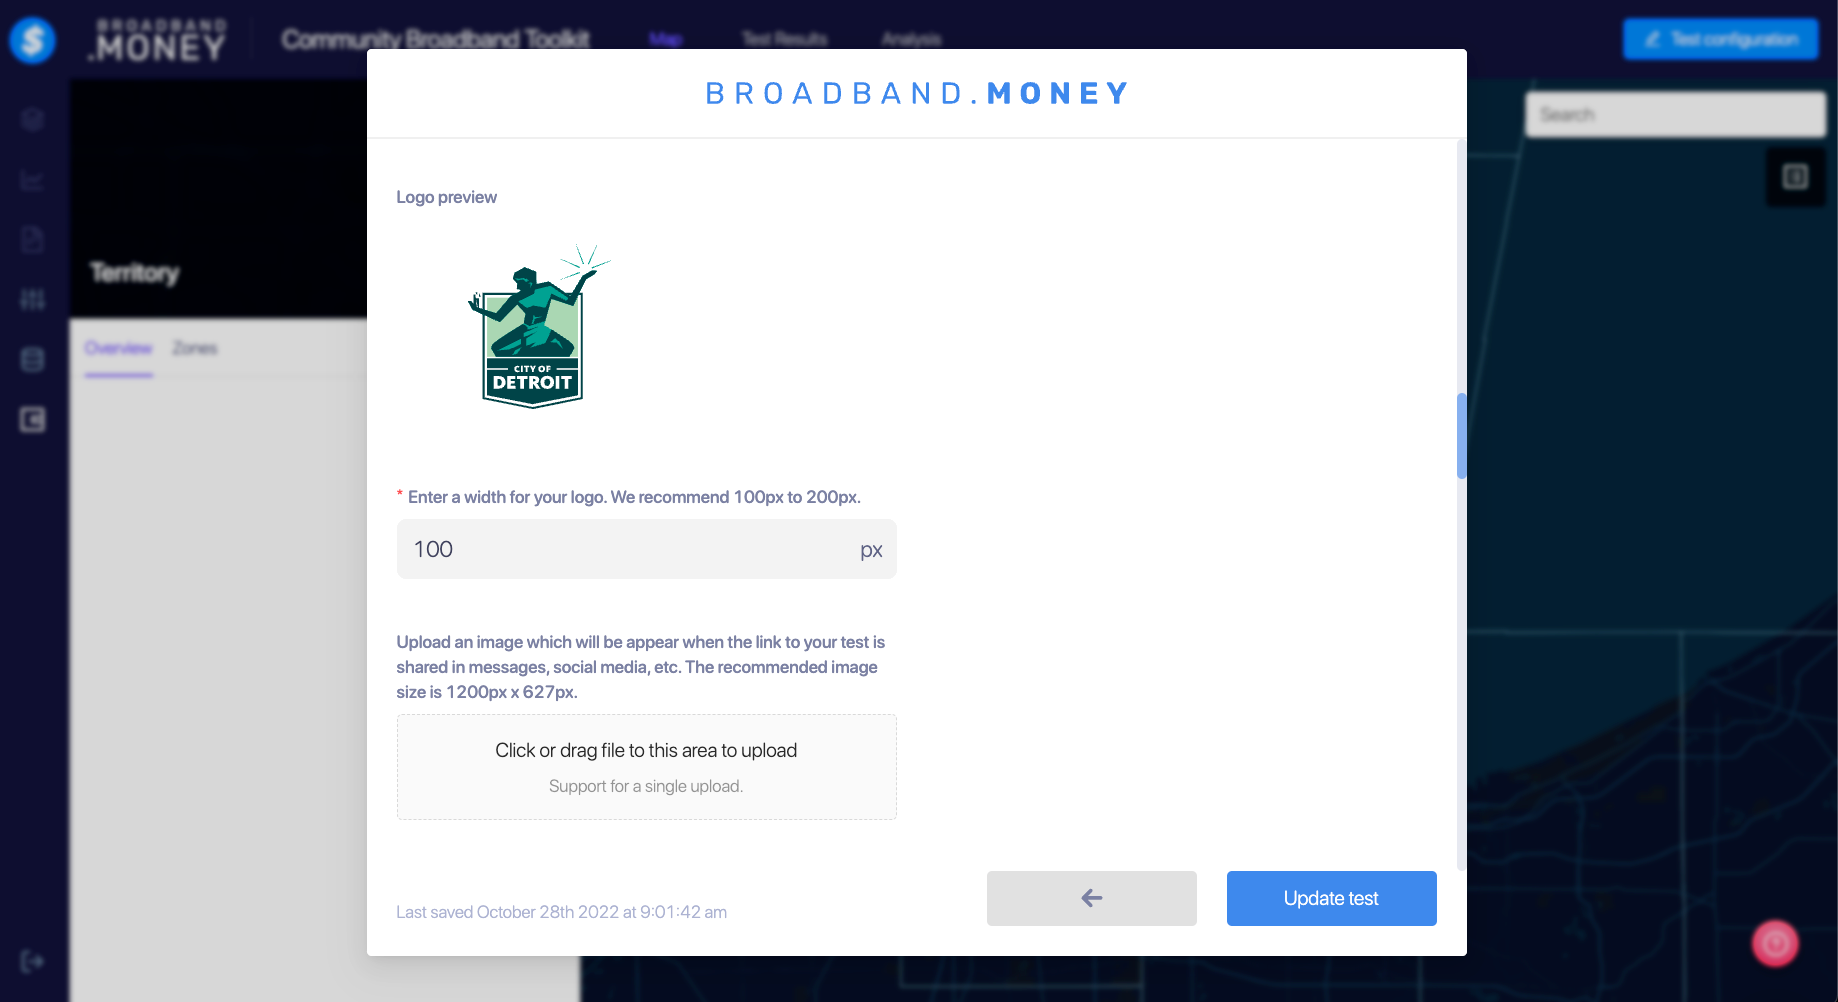
Step 3: Upload a logo of your city, town, county or other geographic unit.
We recommend a logo with the dimensions of 100 to 200 px in a SVG format. You can see how Detroit created the front page of its community broadband kit here.
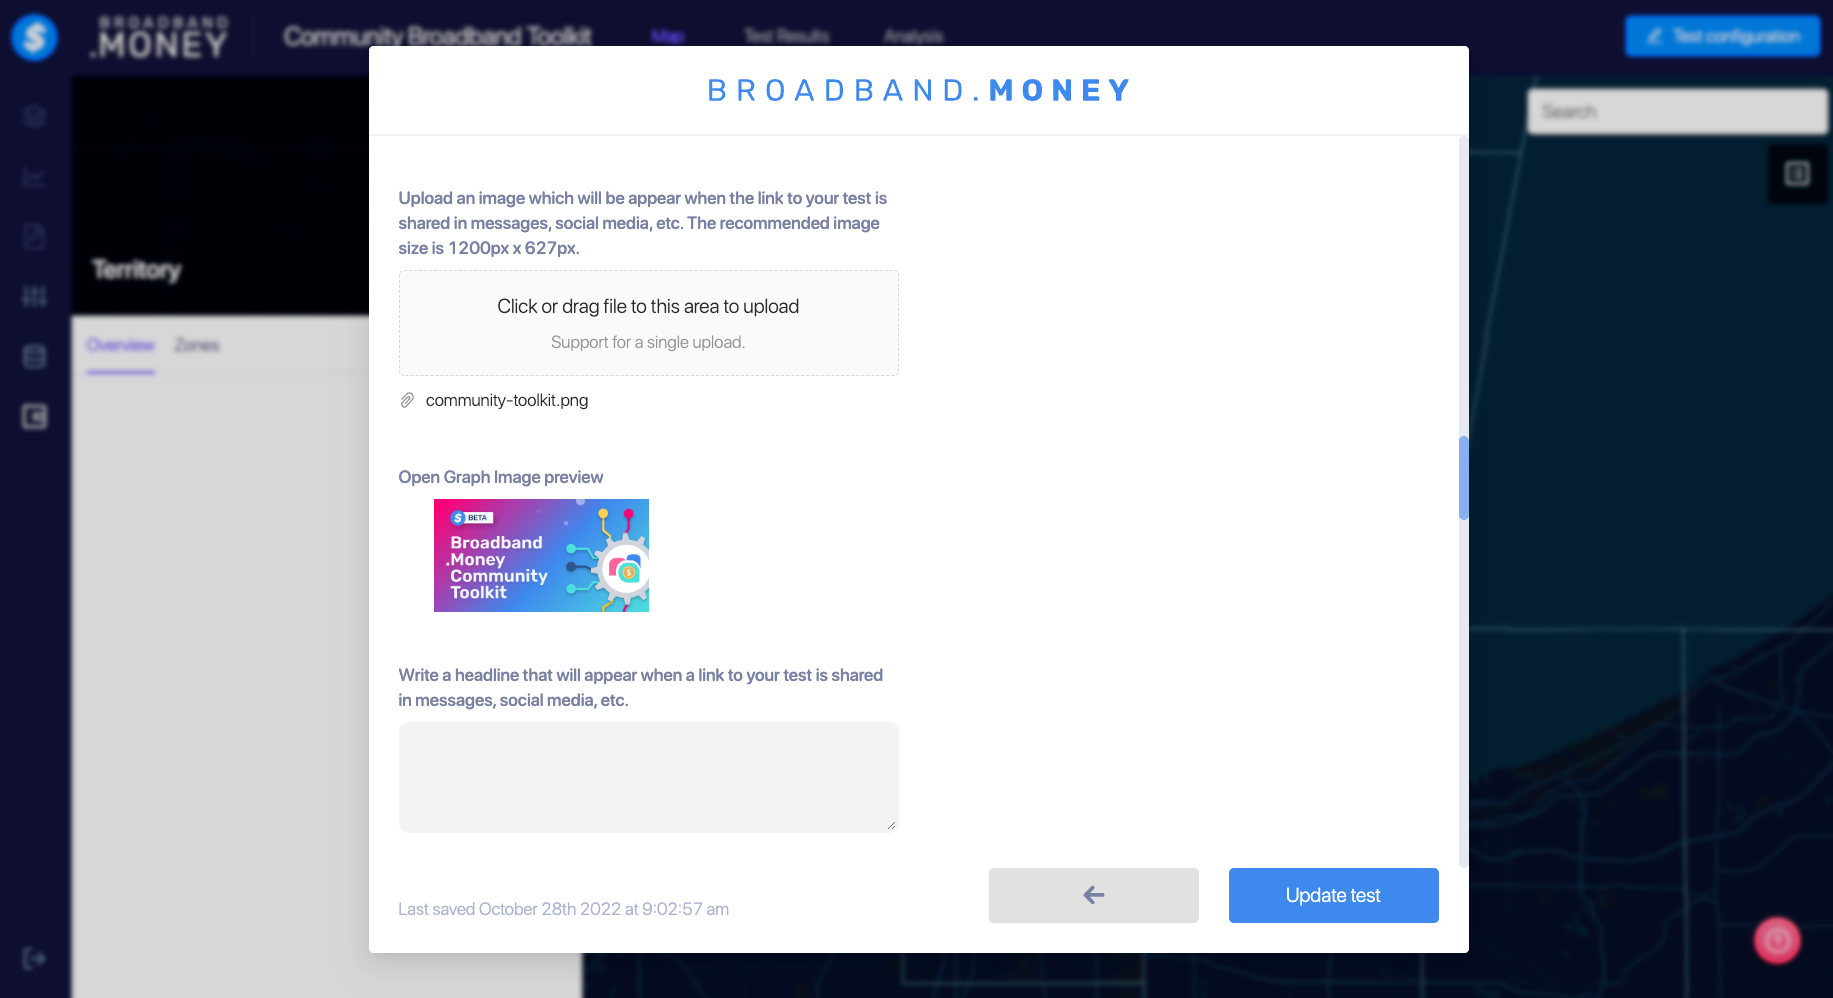
Step 4: Upload an additional image to urge the community to take the broadband kit speed test in social media.
You will also want to share the kit widely to encourage as many people (within your geographic region applying for a broadband grant) to take the test as possible. So use an image that represents your regional broadband community kit. This is called the “Open Graph Image.” The recommended image size is 1200 px x 627 px.
Enter a call to action headline, such as: “Get Better Broadband! Take Hogwarts’ speed test now!”
After that, you want a sentence or two underneath the headline explaining what action you want your audience to take.
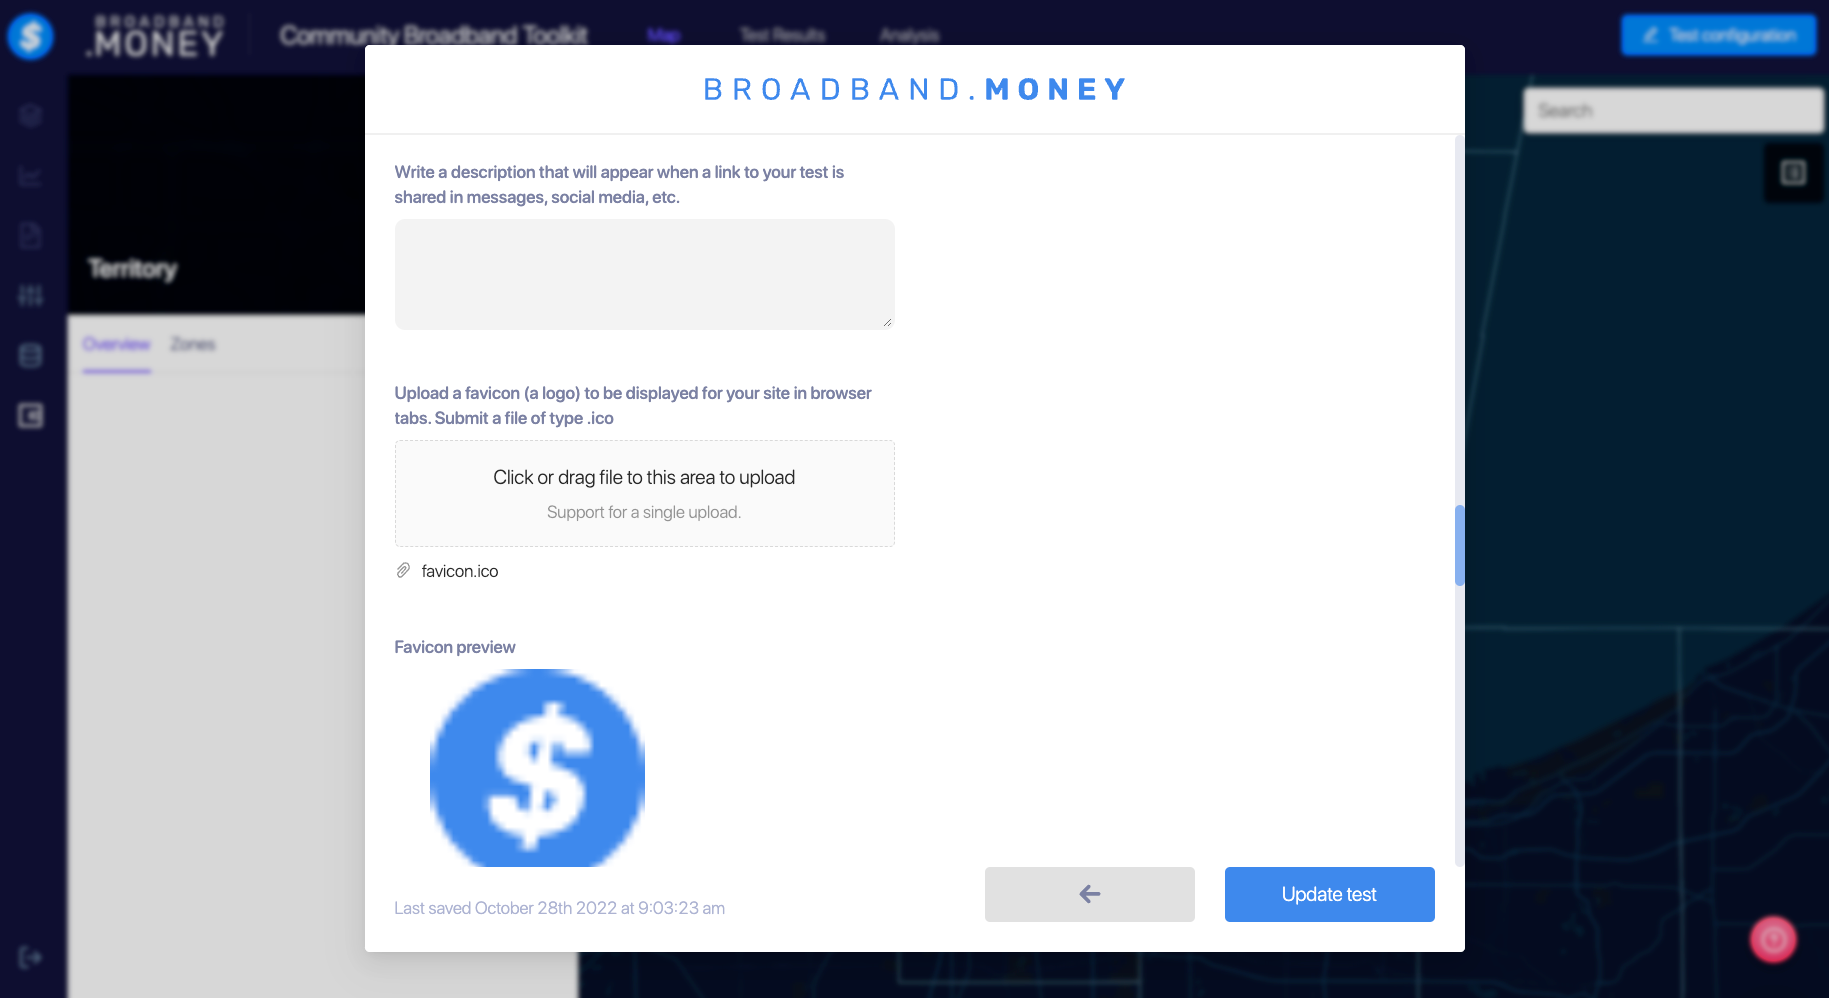
Step 5: Create a favicon for your broadband kit.
Your community broadband kit is a web page and will need what’s called a “favicon.” That’s the tiny image that appears in the tab of your browser. Like the logo of your city/town/county/parish, it represents the web page of your area. You’ll need to pick one to upload so that your community broadband kit can be represented properly in a browser tab. You will be able to preview the favicon right after you’ve uploaded it. You can use free sites such as Favicon.io to create one.
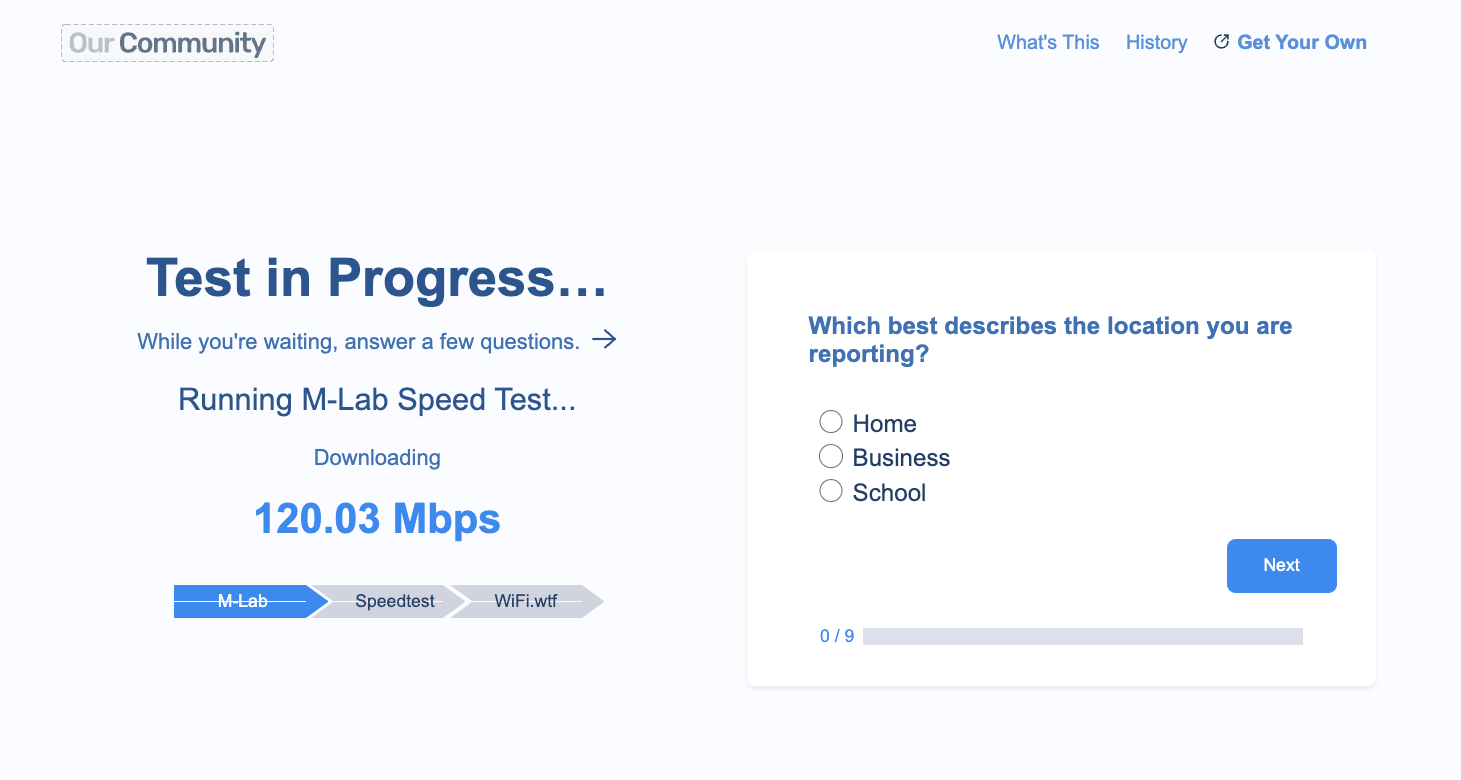
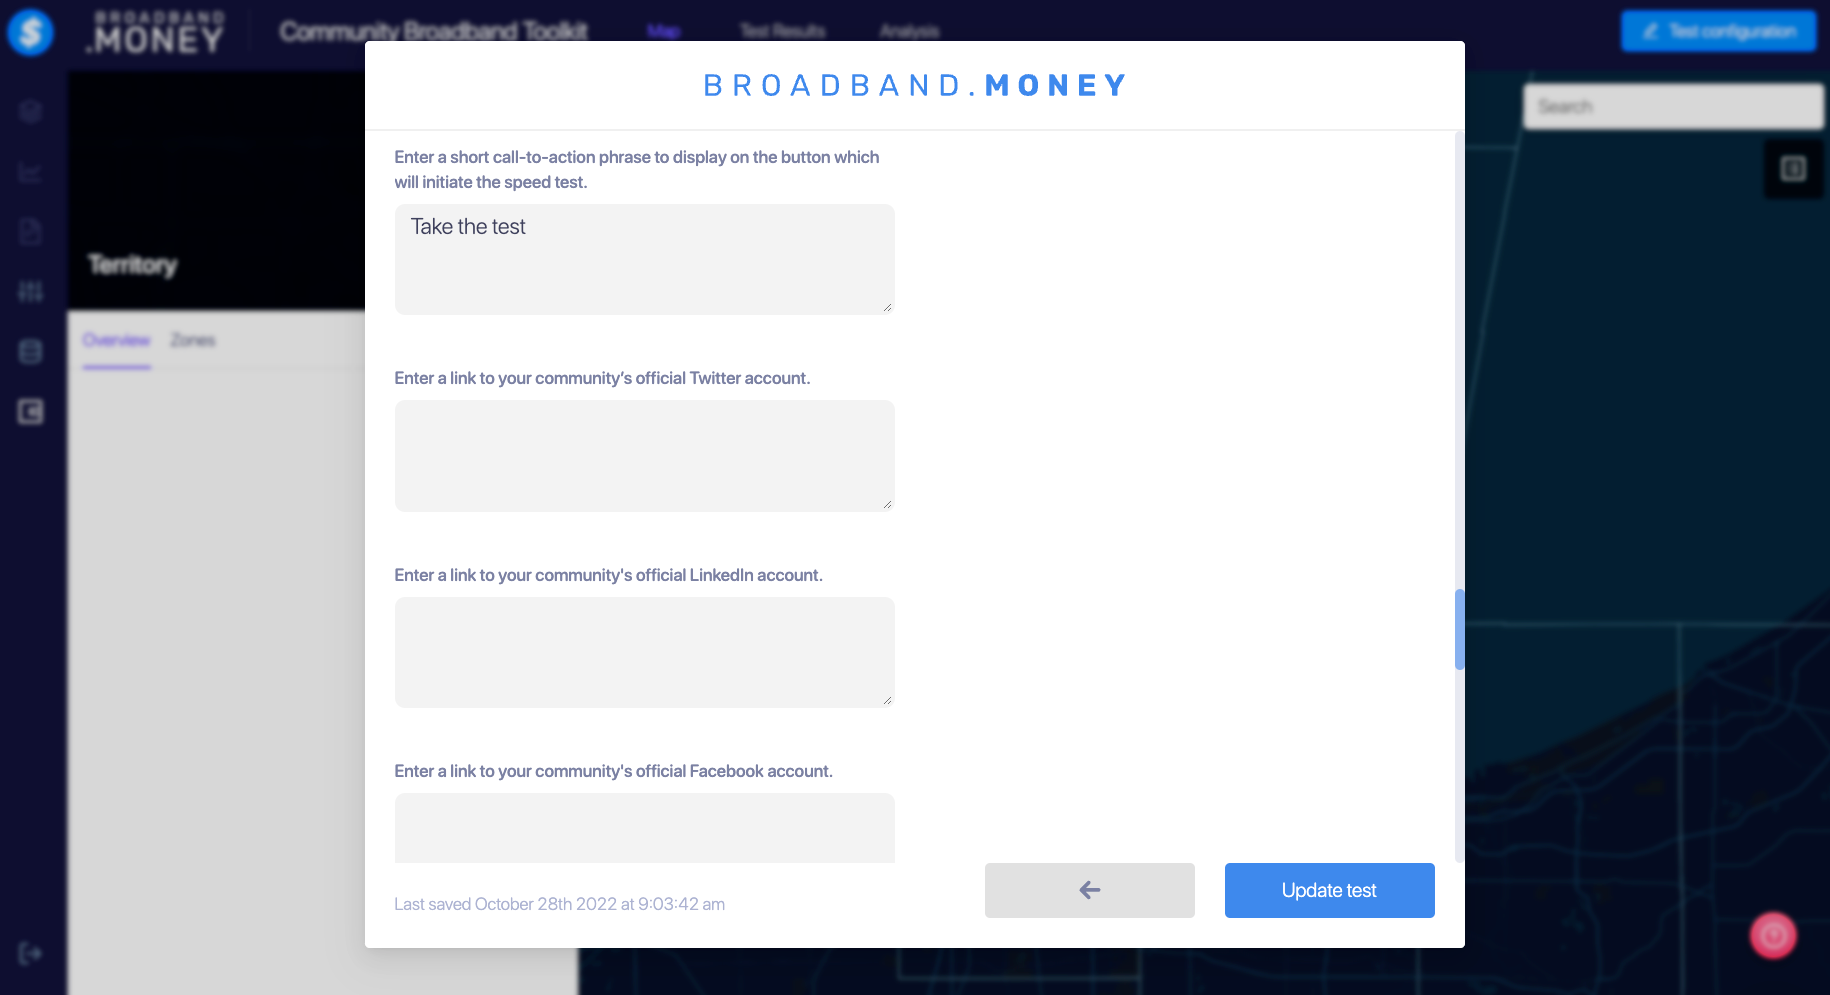
Step 6: Enter a call to action like “take the test” on the test button to urge community members to click to take the test.
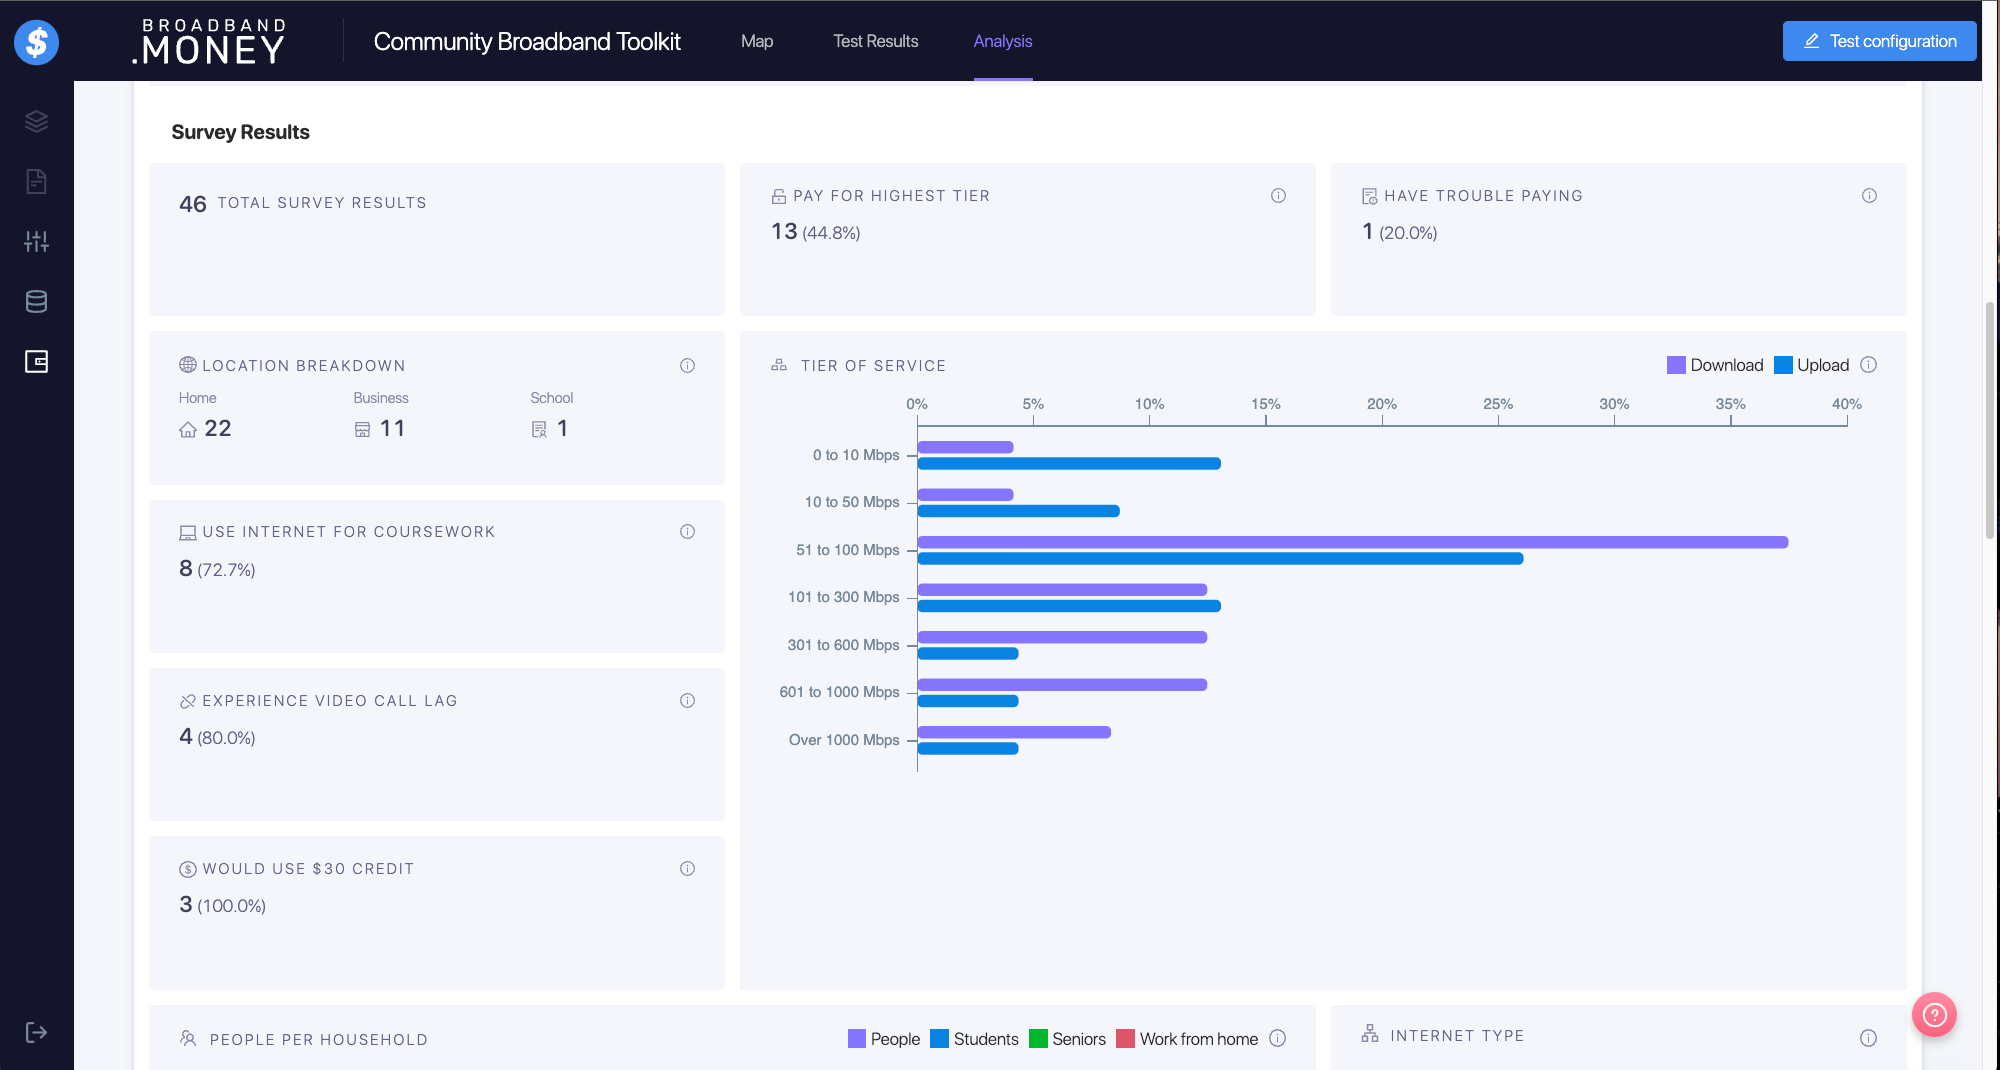
Once test-takers click on the button, the broadband kit will present them with a series of survey questions to provide broadband grant applicants and planners with more information that will help you gain more insights into local connectivity needs. These results will be aggregated in graphical format at the end of the process (see bottom panel.)
Enter links to your community’s social media pages.
Step 7: Enter a “from:” email address, from which you’d like to send messages to residents and community anchor institutions about the Community Broadband Kit and speed tests.
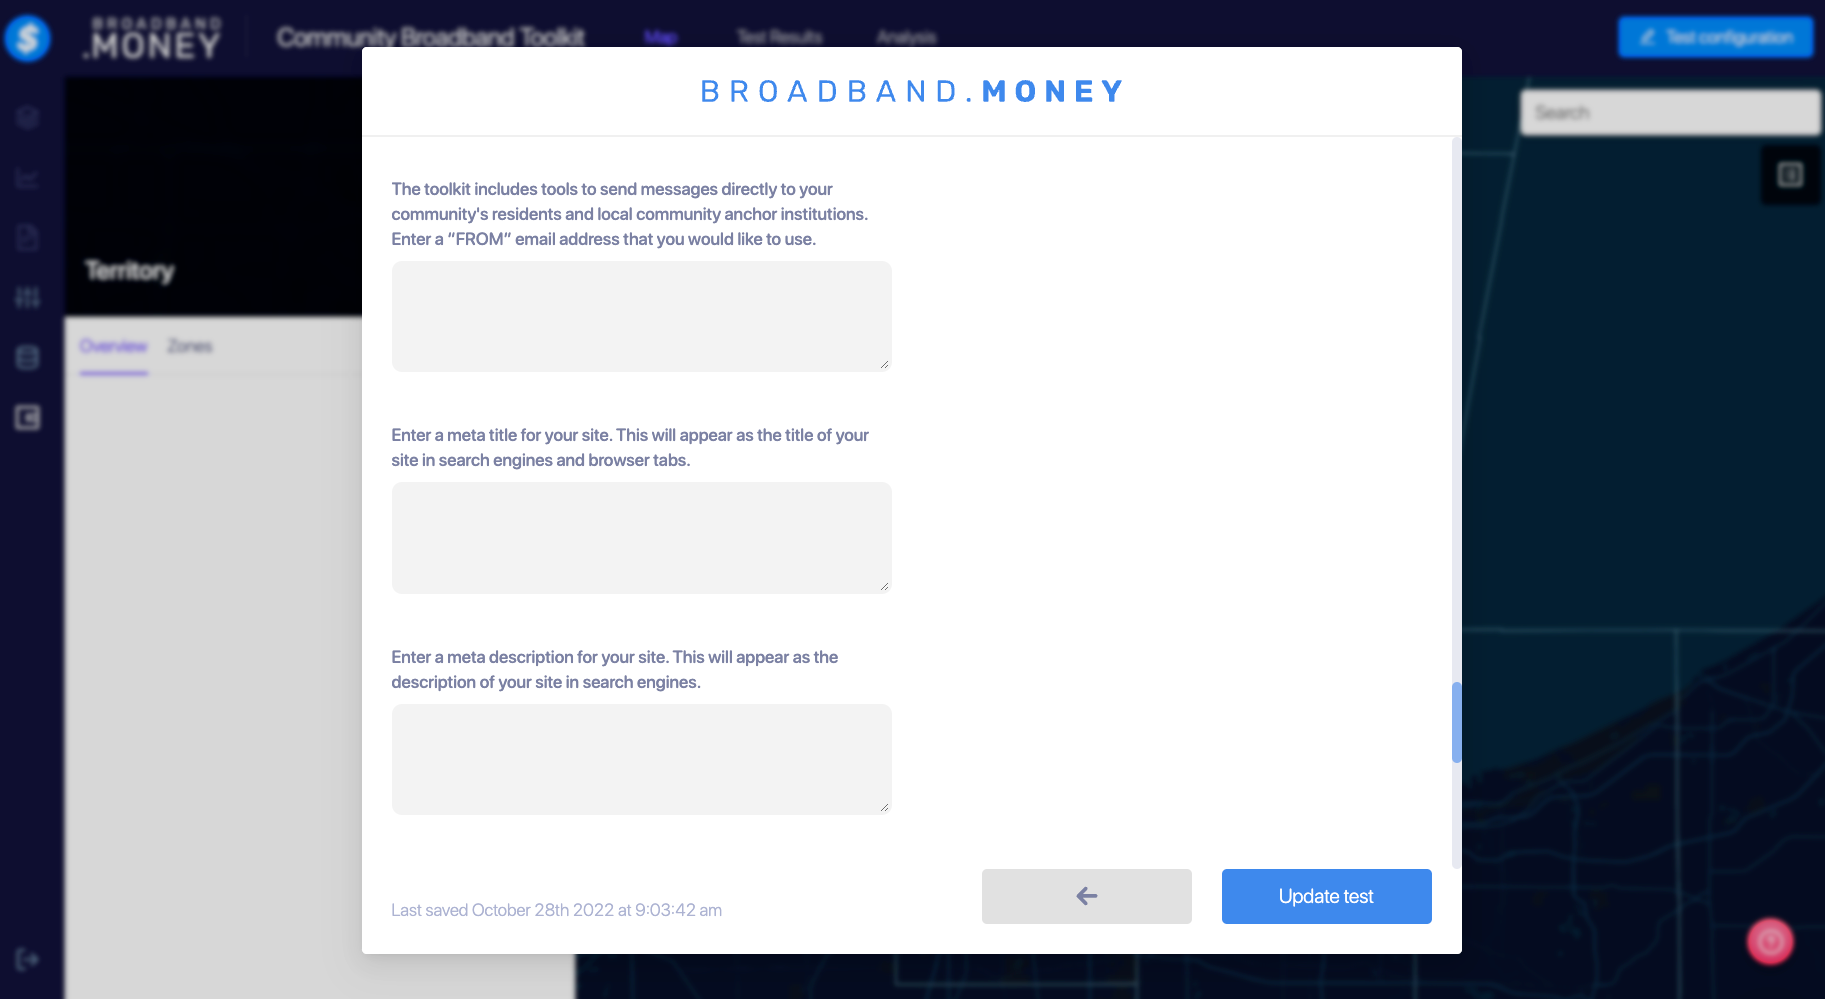
Step 8: Enter a meta title for your community’s broadband toolkit.
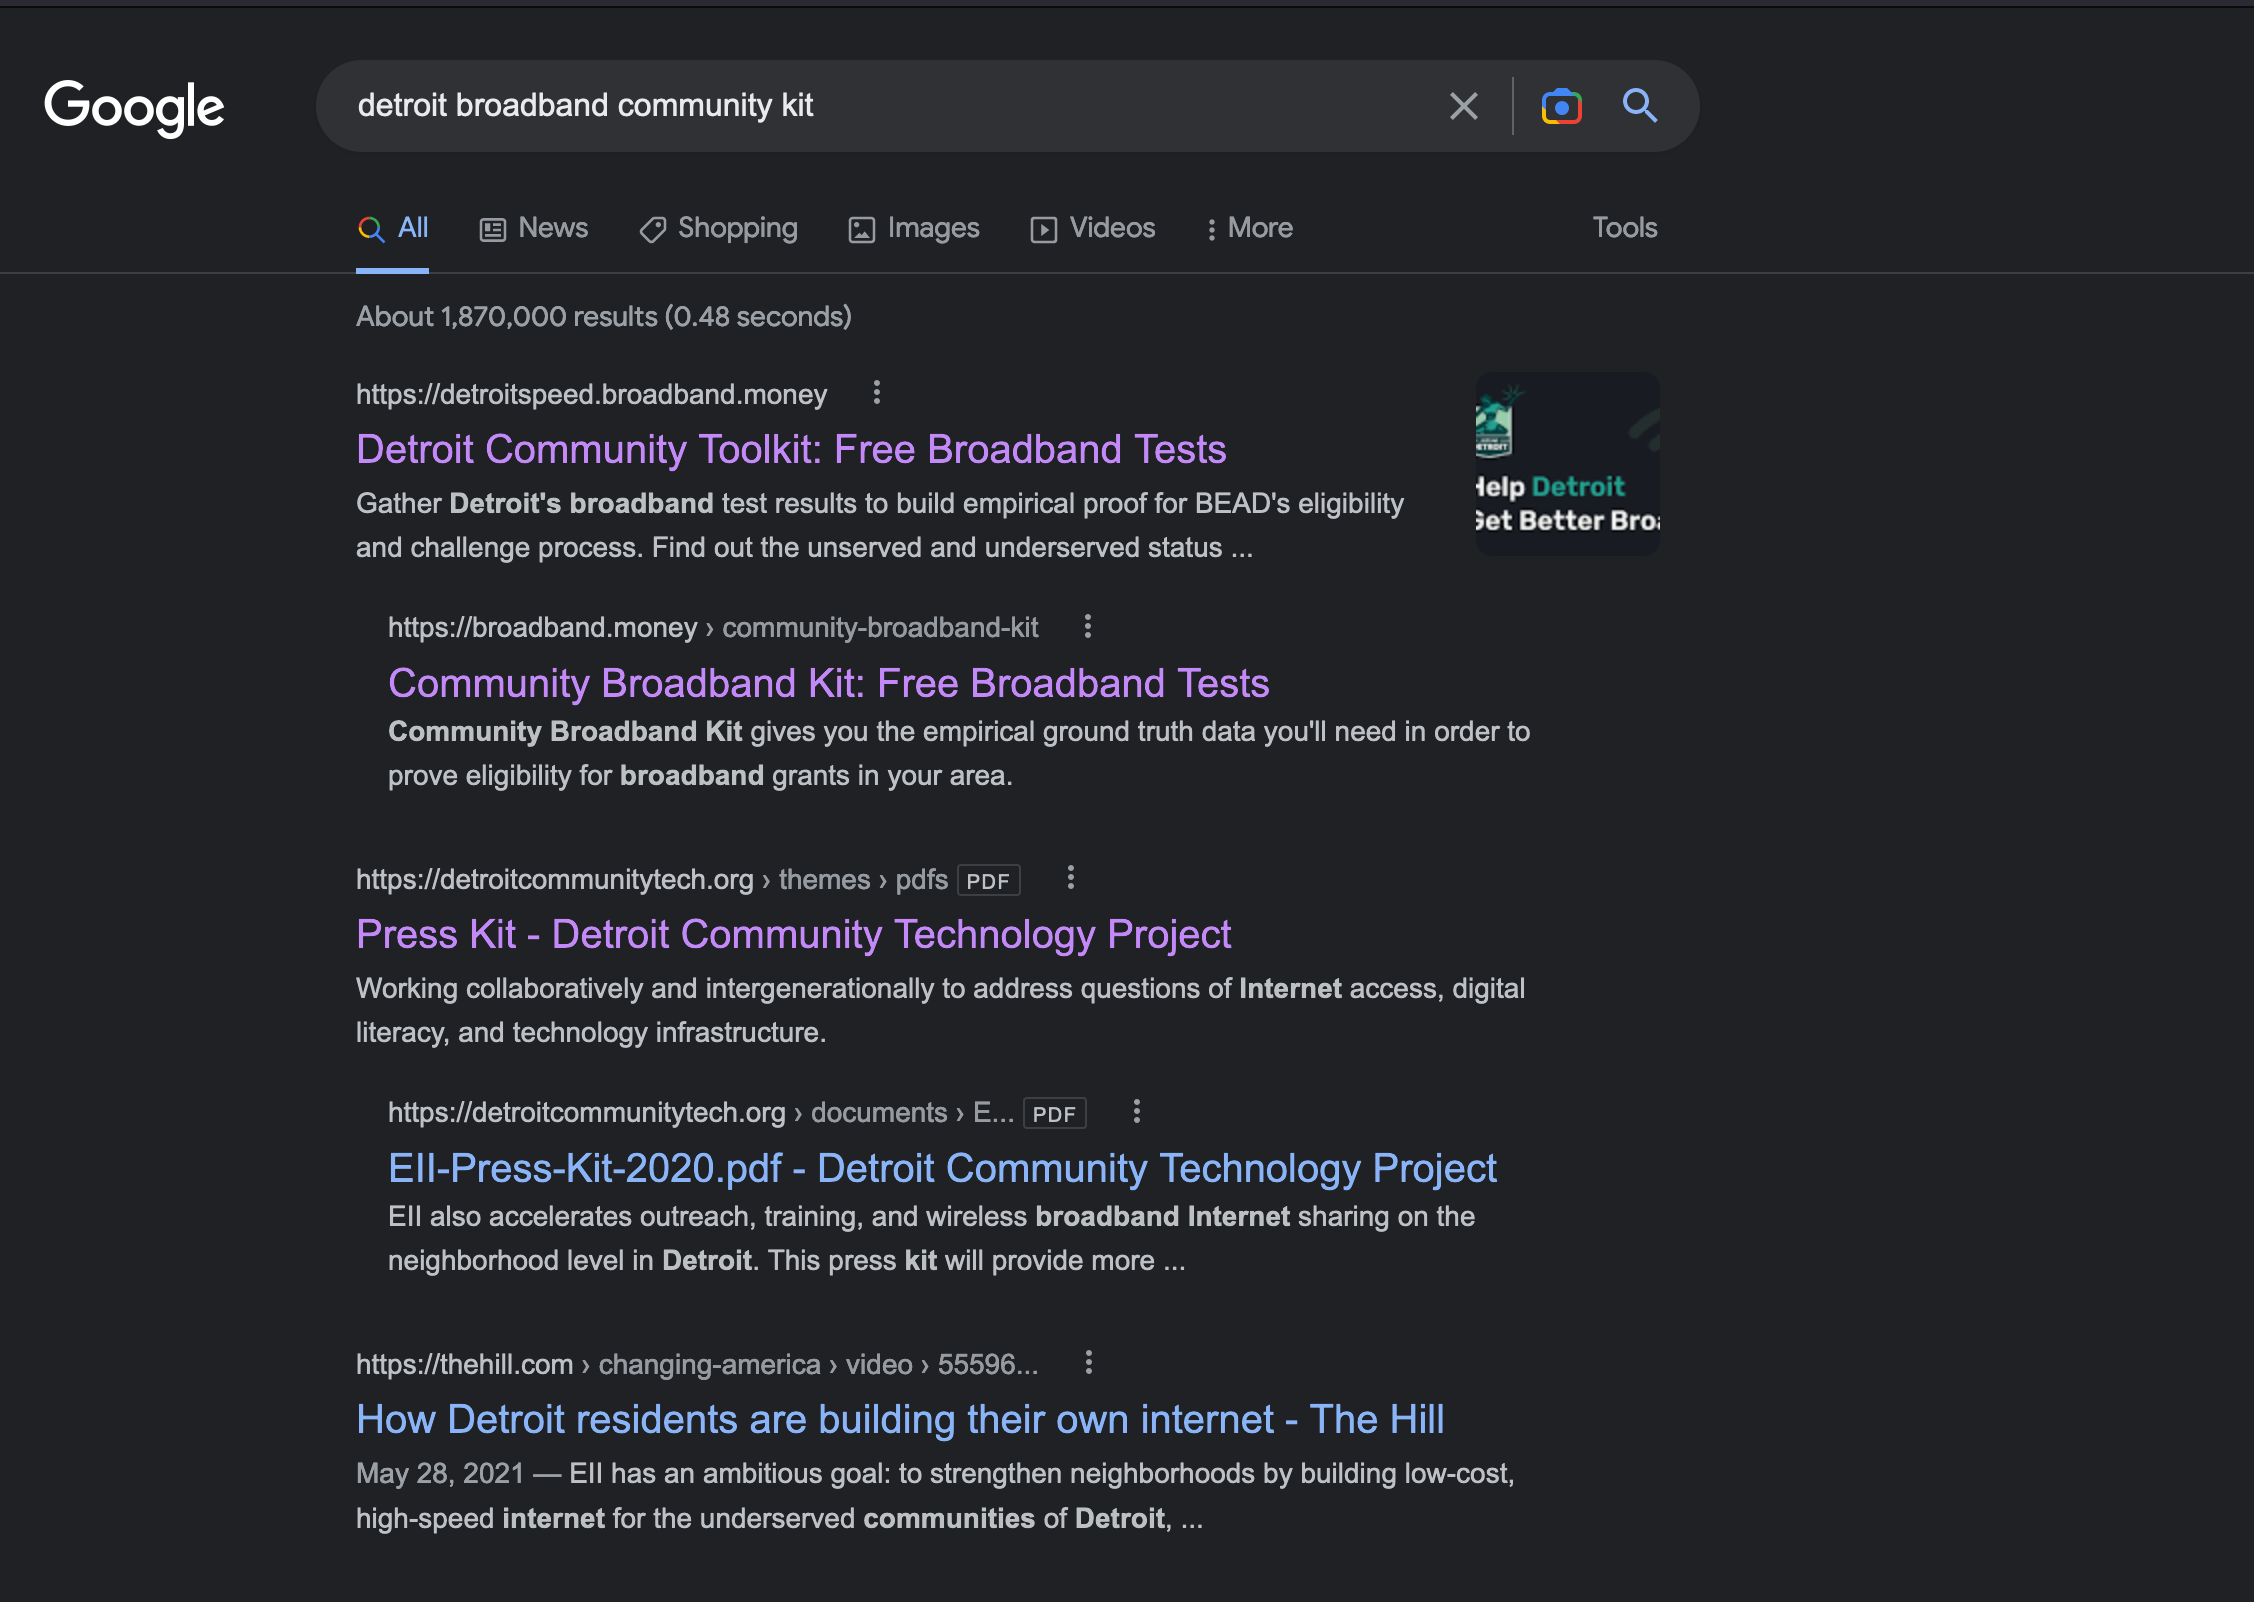
The “meta title” is the headline that appears in search results. A “meta description” is the text that describes the Community Broadband Kit's purpose and function. See above.
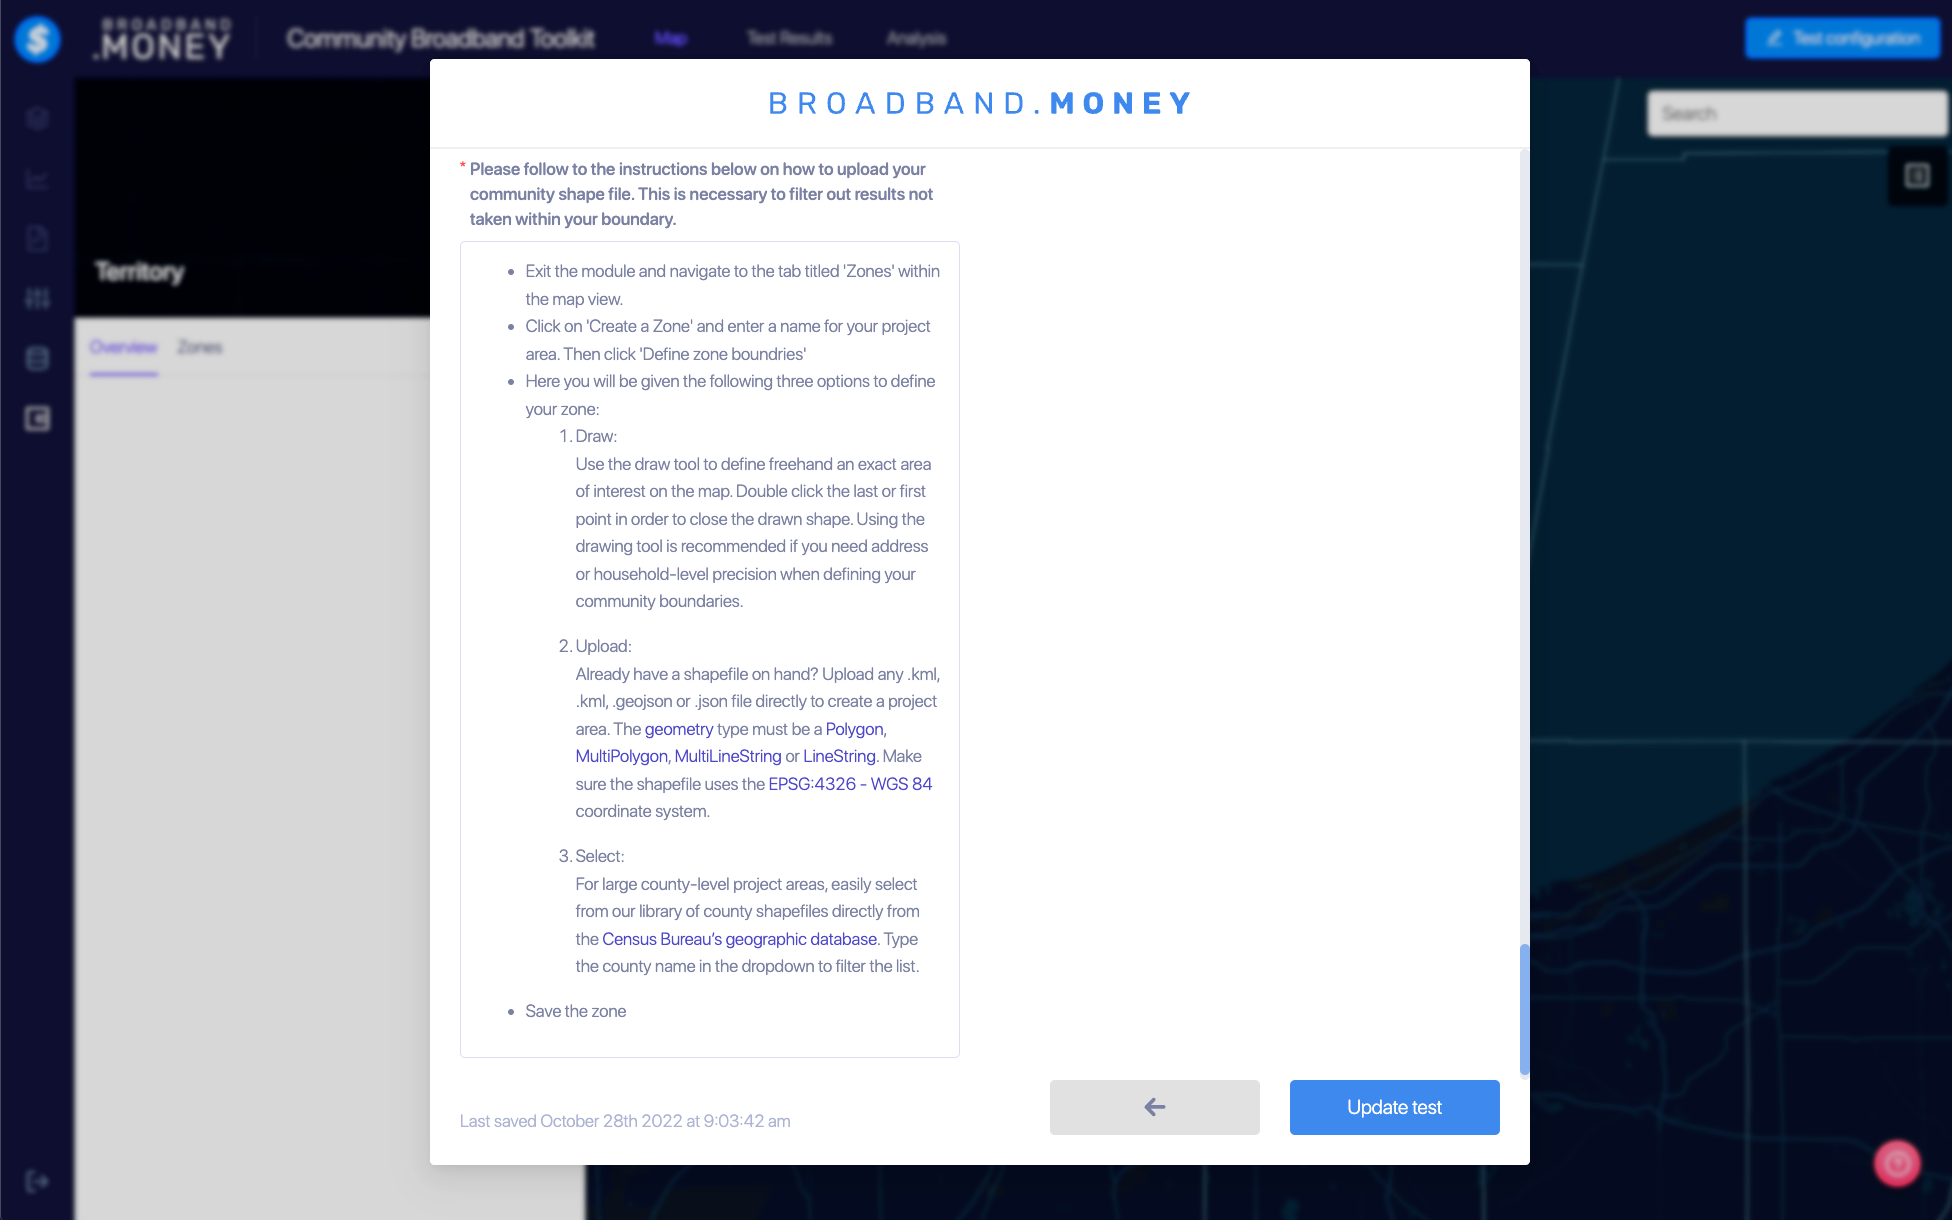
Step 9: Next, you’ll be presented with instructions on how to upload your community shape file.
Once you’ve completed those steps, you’ll see the boundaries of your community within which the test results will appear.
Step 10: Let us complete some behind-the-scene settings.
We’ll notify you when we’ve completed the necessary the behind-the-scenes’ finishing touches.
Step 11: Launch your in-person and online campaign.
Encourage as many community members as possible to take the broadband kit speed tests. The test itself takes a minute.
Test results can be viewed immediately, and in multiple ways. For example, you can view them geographically within the boundaries you’ve established, or in a table, or represented on a graph.
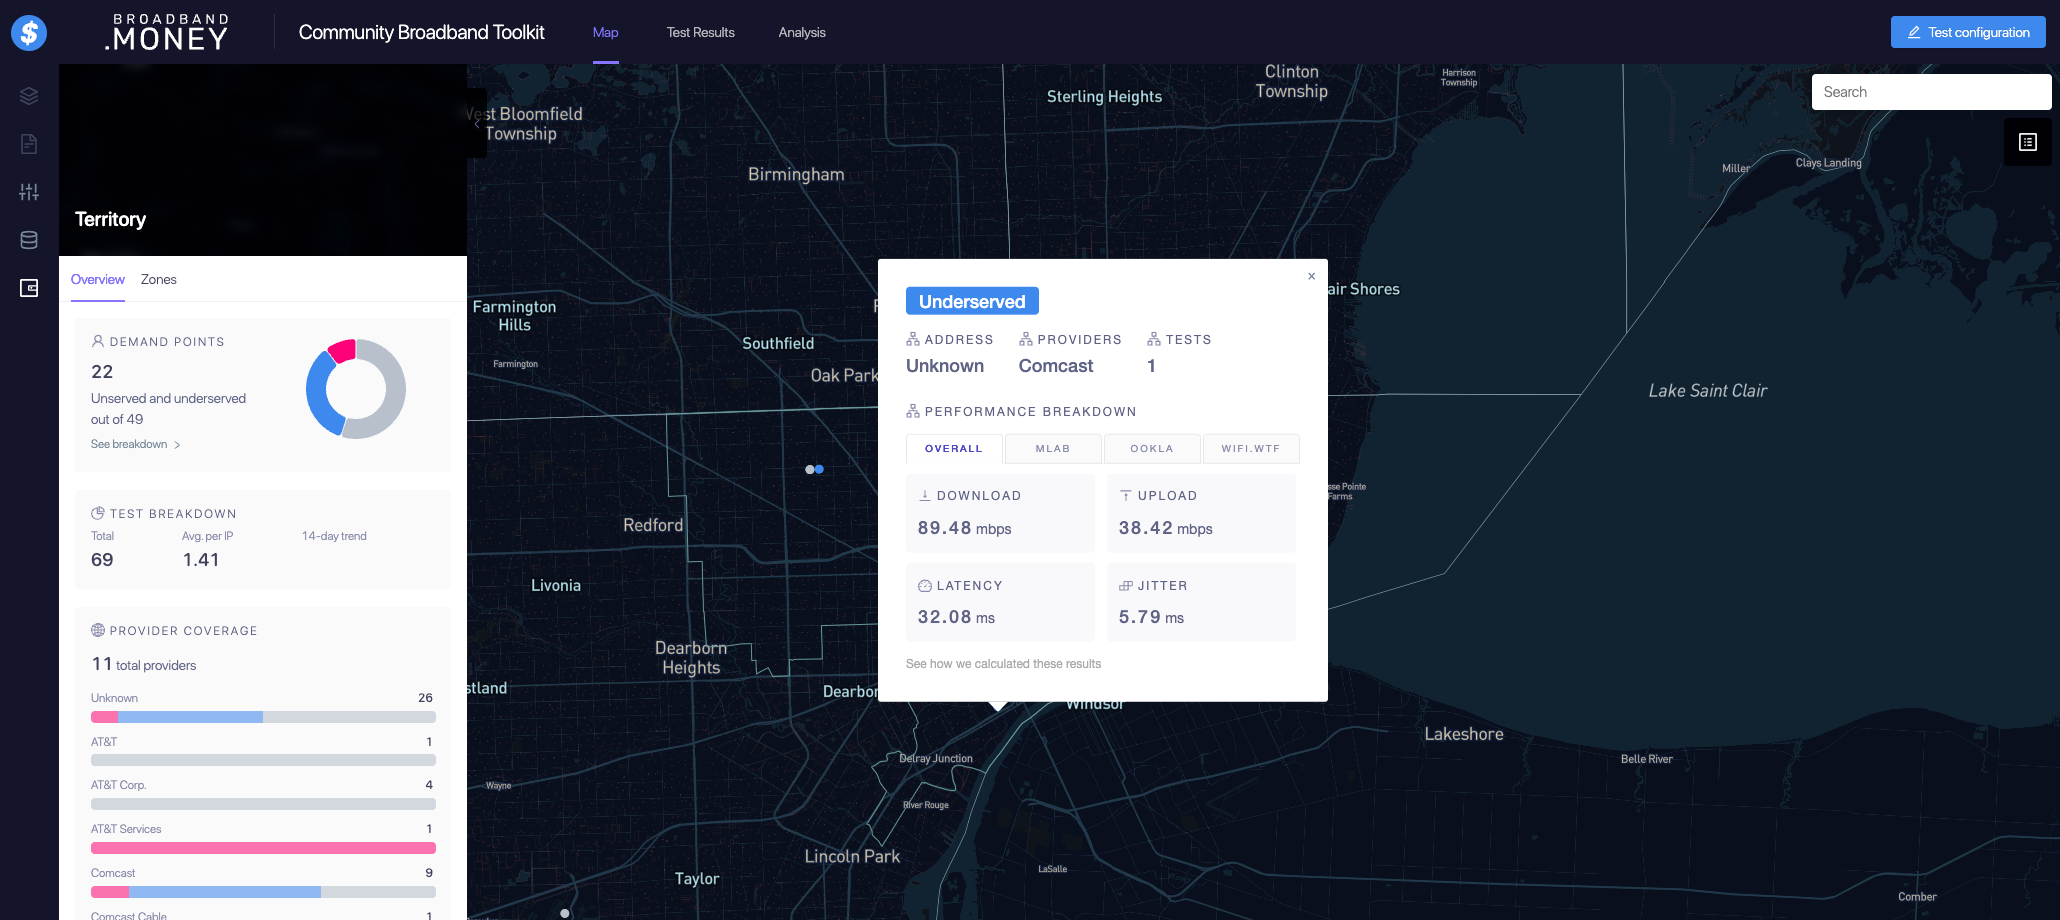
The results will show the address at which tests were taken (if the test taker provided the information,) the number of tests taken, and the provider name.
The Community Broadband Kit administers three different varieties of tests simultaneously. The results of all three tests, run by MLab, Ookla and WIFI.WTF, will be consolidated and displayed. The measurements displayed are download and upload speeds, latency and jitter.
The system will then generate a summary infographic that shows you what percentage of the test-taker residents would be considered unserved and underserved, as defined by BEAD, among other things (see below.)
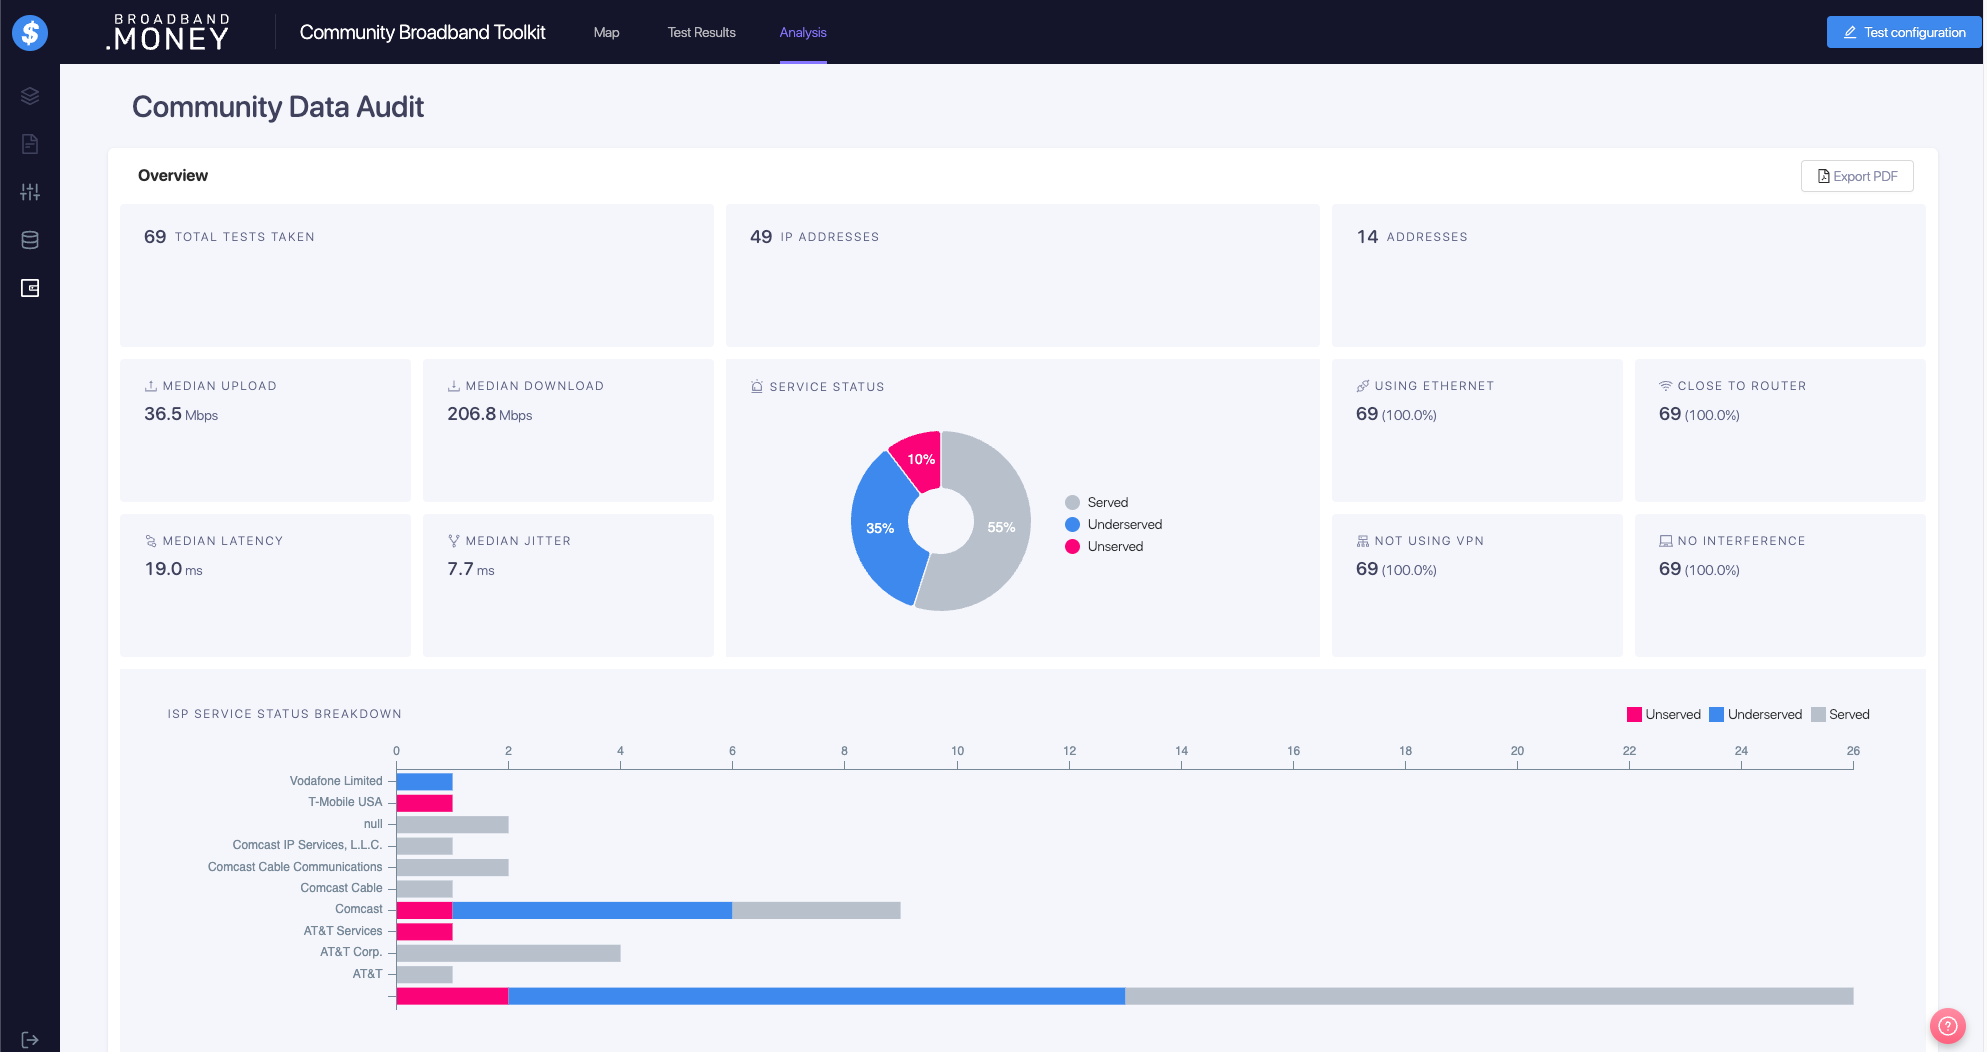
You will also be able to see more detailed statistical analyses of all of the aggregated information about the tests in charts on a dashboard.
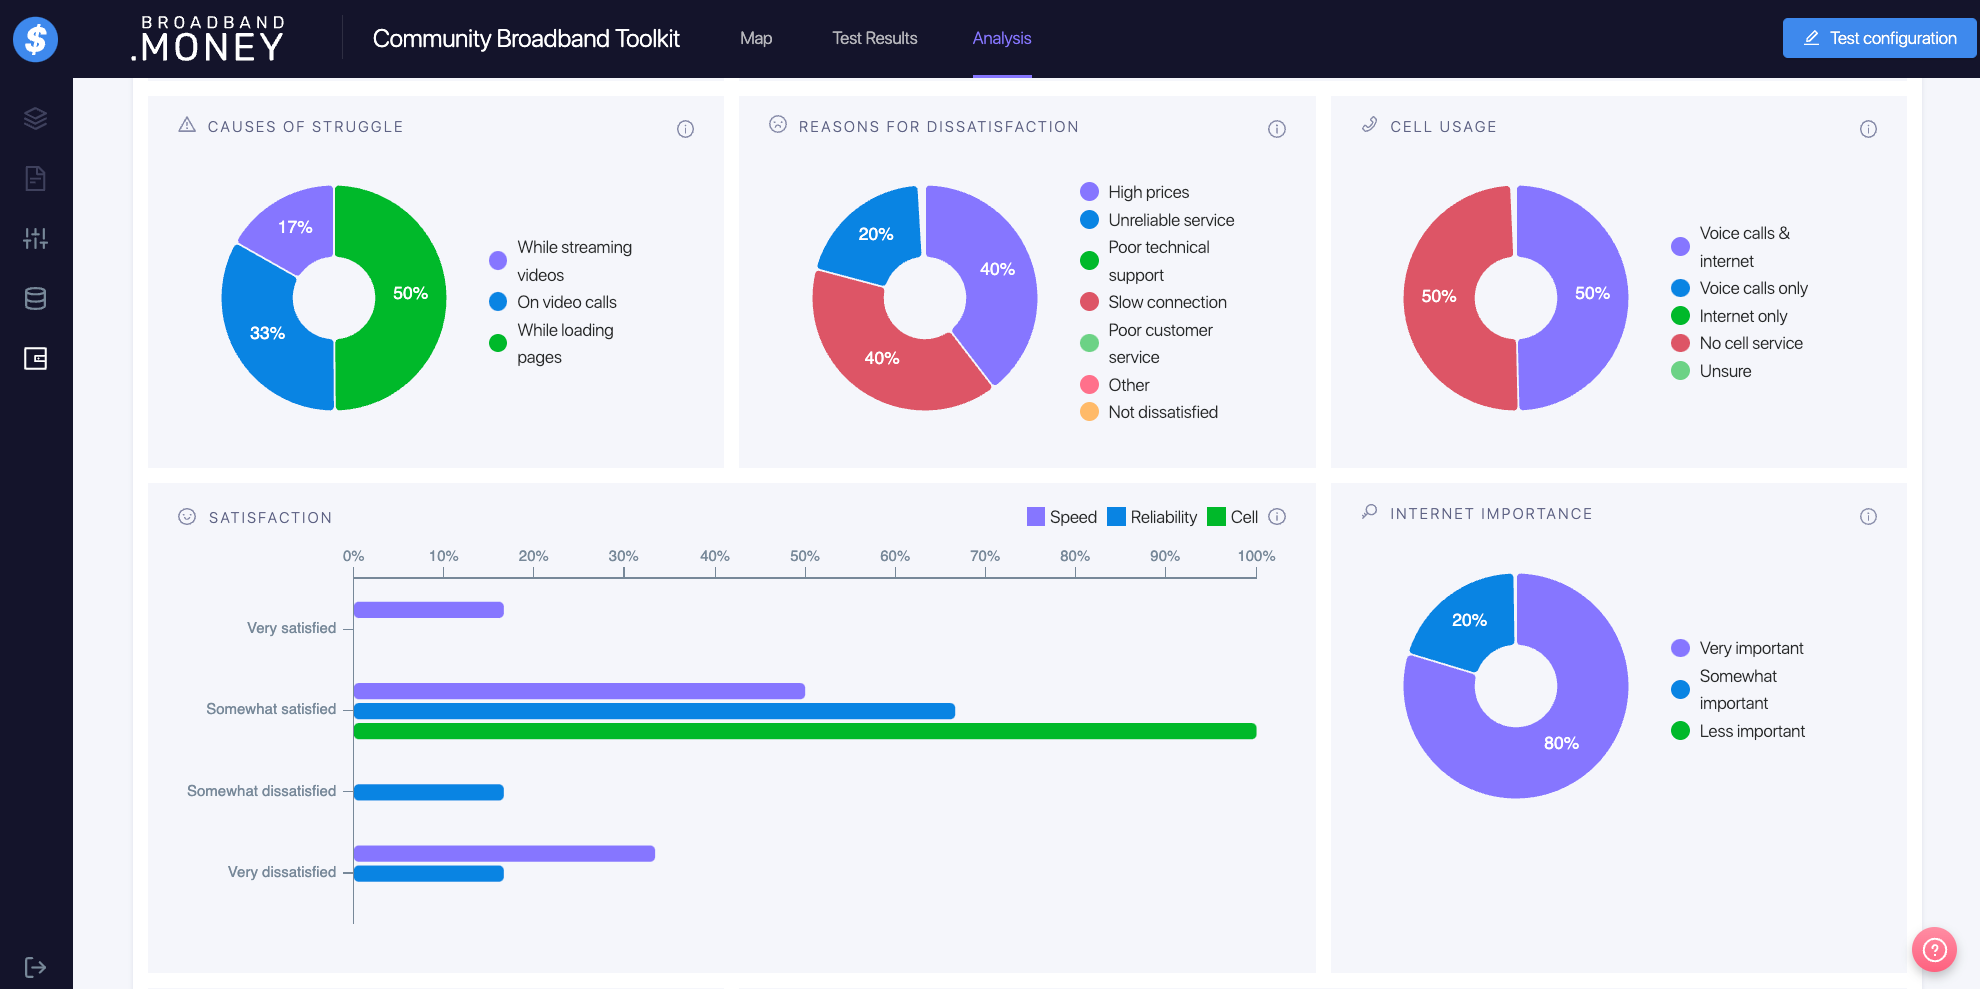
In addition, you’ll be able to view graphical representations of the quantitative aggregation of accompanying survey results.

Have a suggestion?
We’d love any feedback. Submit here
Enroll for free today
It's free. Find out if you qualify for Broadband.money assistance.
